
While air quality in the LADCO region is better than it has ever been, challenges exist to reduce the air pollution risk to the human and natural resources in the region.
The Public Issues section of our website presents the background, current state, and future challenges of the major air pollution issues in our region. We are presenting this information in terms that are accessible to the general public to help our neighbors understand the public health and economic implications of air pollution in the LADCO region.
The Big Picture
The first thing to point out about the air quality across the LADCO region is that it is better than it has ever been. Over the past 20 years the total emissions of several major air pollutants have dropped 50%. Ozone and fine particulate matter (PM2.5) concentrations have decreased 22% and 45%, respectively. The number of haziest days in our scenic areas have decreased by over 40%. All of these improvements have occurred while the regional annual Gross Domestic Product (GDP) has doubled over the same period. Both population and vehicle miles traveled have also increased (~10%) over the past 20 years.
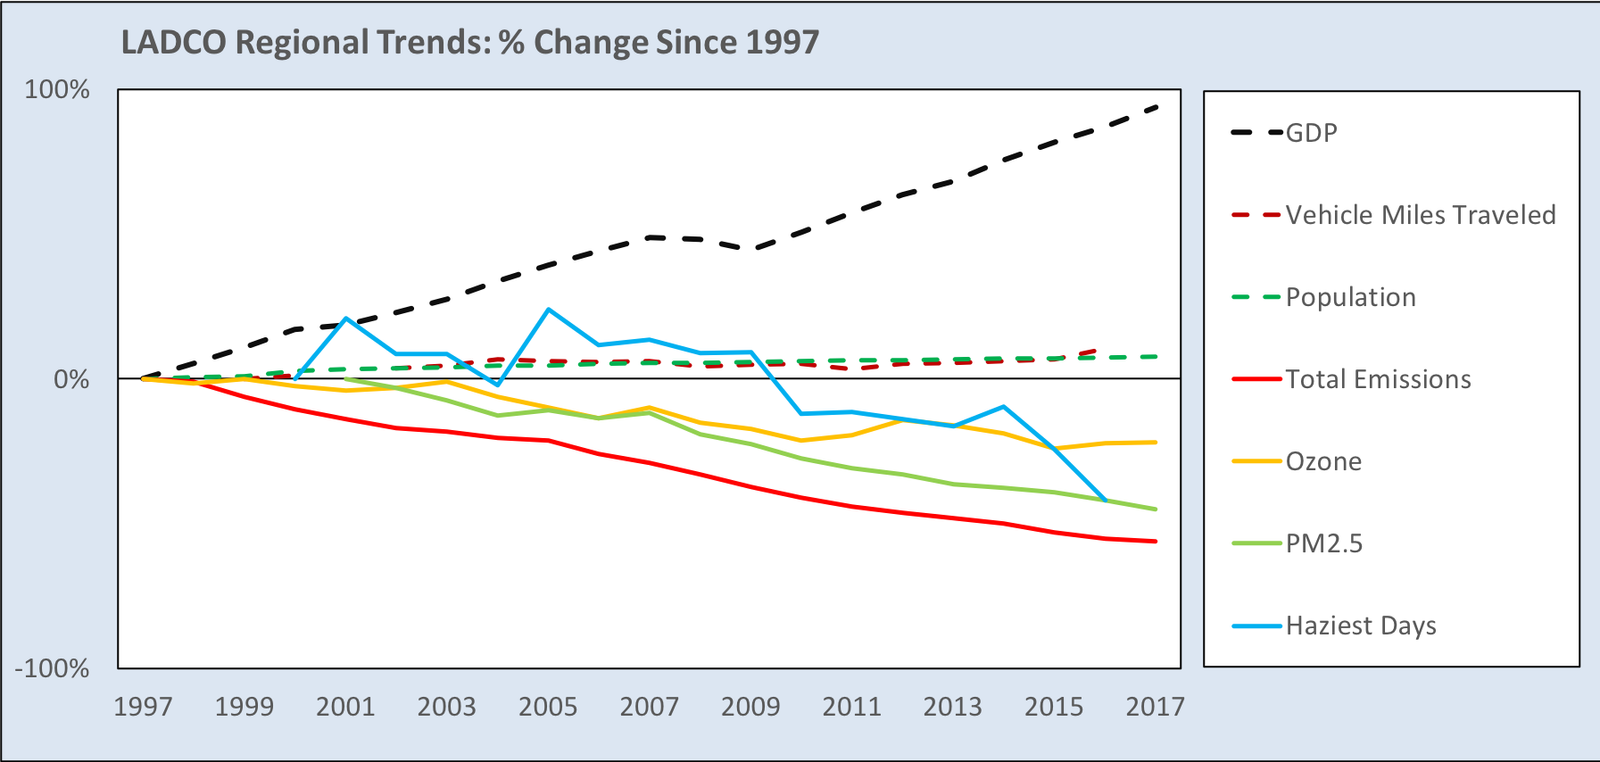
[1] Total Emissions = annual total CO, NOx, VOC, NH3, PM10, SO2
[2] Ozone = ozone design values at all monitors in the LADCO states operating since 1997
[3] PM2.5 = annual mean concentrations at all monitors operating since 2001
[4] Haziest days = Average of 20% worst days at Boundary Waters, Isle Royale, Voyageurs, and Seney
Download Source Data for this chart
Our Region
Covering over 440,000 square miles and with a population of over 50M people, the LADCO region is rich in natural and human resources. The Great Lakes are one of the largest freshwater ecosystems on Earth and contain 84% of the fresh surface water in the U.S. As the gateway to the Great Plains and Western Appalachia, our region transforms and transports the rich natural resources of the U.S. heartland for use around the country and around the world. Agriculture, energy generation, heavy industry, and manufacturing are important parts of our regional economy. Sprawling urban areas are hubs of innovation, finance, education, and the arts.
Diverse natural resources exist along side with the developed features in the region. From the dense coniferous and hardwood forests in the north to the vast grasslands and prairies in the south to the wetlands and dunes along the lakeshore, the region contains important ecosystems for indigenous and migratory species.
The unique built and natural features of the Great Lakes region present a challenge for air quality planners. Industrial, transportation, and agricultural emissions interact with the meteorology over and around the lakes to produce air pollution. Despite these challenges, LADCO, our member states, and U.S. EPA have worked to make great strides in reducing air pollution in our region.
Air Quality History

On December 31, 1970 Congress passed the Clean Air Act (CAA) to protect our nation’s human and ecological health from air pollution. Several amendments and rules associated with the CAA have provided the EPA and the states statutory authority to monitor and enforce air pollution laws. In establishing national baselines for air quality, the CAA prevents a race-to-the-bottom and requires all states to maintain air pollution levels that are protective of public health.
The progress toward clean air in the LADCO region since the establishment of the CAA has been dramatic, as seen in a comparison of the data in EPA’s 1978 Air Quality Trends report [1] to current conditions in our region.
The table below compares observed air quality in the mid-1970’s to observations in 2017. All three of the pollutants in this table, particulate matter (PM), ozone, and sulfur dioxide, have much lower concentrations today than in the past.
Historical Air Quality Trends at Major Cities in the LADCO Region
| Location | Particulates (Avg Max 24-hour) [3] | Ozone (2nd highest hour) | Sulfur Dioxide (Annual Avg) | |||
|---|---|---|---|---|---|---|
| Time Period | 1974-76 [1] | 2017 [2] | 1974-76 [1] | 2017 [2] | 1974-76 [1] | 2017 [2] |
| Chicago, IL-IN | 256 ug/m3 TSP | 82 ug/m3 PM10 | 233 ppb | 100 ppb | 9 ppb | 2 ppb |
| St. Louis, MO-IL | 238 ug/m3 TSP | 125 ug/m3 PM10 | 230 ppb | 100 ppb | No Data | 2 ppb |
| Detroit, MI | 191 ug/m3 TSP | 133 ug/m3 PM10 | 232 ppb | 90 ppb | 6 ppb | 3 ppb |
| Cleveland, OH | 245 ug/m3 TSP | 67 ug/m3 PM10 | 174 ppb | 90 ppb | 21 ppb | 1 ppb |
| Indianapolis, IN | 226 ug/m3 TSP | 54 ug/m3 PM10 | 155 ppb | 80 ppb | 11 ppb | 1 ppb |
[1] U.S. EPA, Air Quality Trends in the Nation’s Largest Urbanized Areas, U.S. EPA Office of Air Quality Planning and Standards, RTP, NC, March 31, 1978
[2] U.S. EPA, Air Quality Statistics Report, accessed online August 24, 2018
[3] The PM comparison is imperfect because we now measure PM10 instead of total suspended particulates (TSP). Even if we assume that we’re missing 50% of the TSP mass in the PM10 measurement (which is a conservative estimate for urban sites), we still observe significantly lower PM concentrations in our region than in the past.
The Challenges Ahead
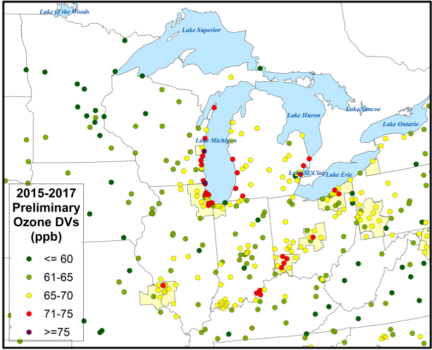
Despite the progress in reducing air pollution over the last three decades, there are persistent problems in the region. Ground-level ozone concentrations continue to exceed the National Ambient Air Quality Standards (NAAQS) along the shores of Lake Michigan and in many of our larger urban areas. The map at the left shows recent policy-relevant ozone concentrations (i.e., design values) at measurement sites in our region. The locations that are exceeding the NAAQS are shown as red and purple.
The ambient ozone concentrations at measurement sites throughout the region are still exceeding the NAAQS, despite continued reductions in emissions of ozone precursors. Weather is a major driver of ozone pollution (warmer years produce higher ozone concentrations) and with average temperatures trending upward, we expect to see more ozone conducive conditions in the coming years.
Finding new ways to reduce ozone concentrations is arguably the biggest air quality issue facing our region today. Identifying the drivers and finding solutions to our air pollution problems are fundamental charges of LADCO.