LADCO Exceptional Events Screening Metric
Approach/Scope
Develop an approach for screening near real-time surface and remote sensing monitoring data for potential exceptional event contributions to air quality problems in the LADCO states. The following workflow is being used by LADCO for screening air quality data.
- Airnow Tech is the first tool to use for this triage analysis.
- LADCO will identify the days where MDA8 O3 > 70 ppb at each monitor, and highlight the top days that are contributing to the design value
- Analysis will focus on identifying if there could be smoke enhancements on the high days and DV days at the violating monitors
- Discussion questions:
- How to bring in PM2.5 and CO, other pollutants?
- What are the next steps after potential days are identified
Methods
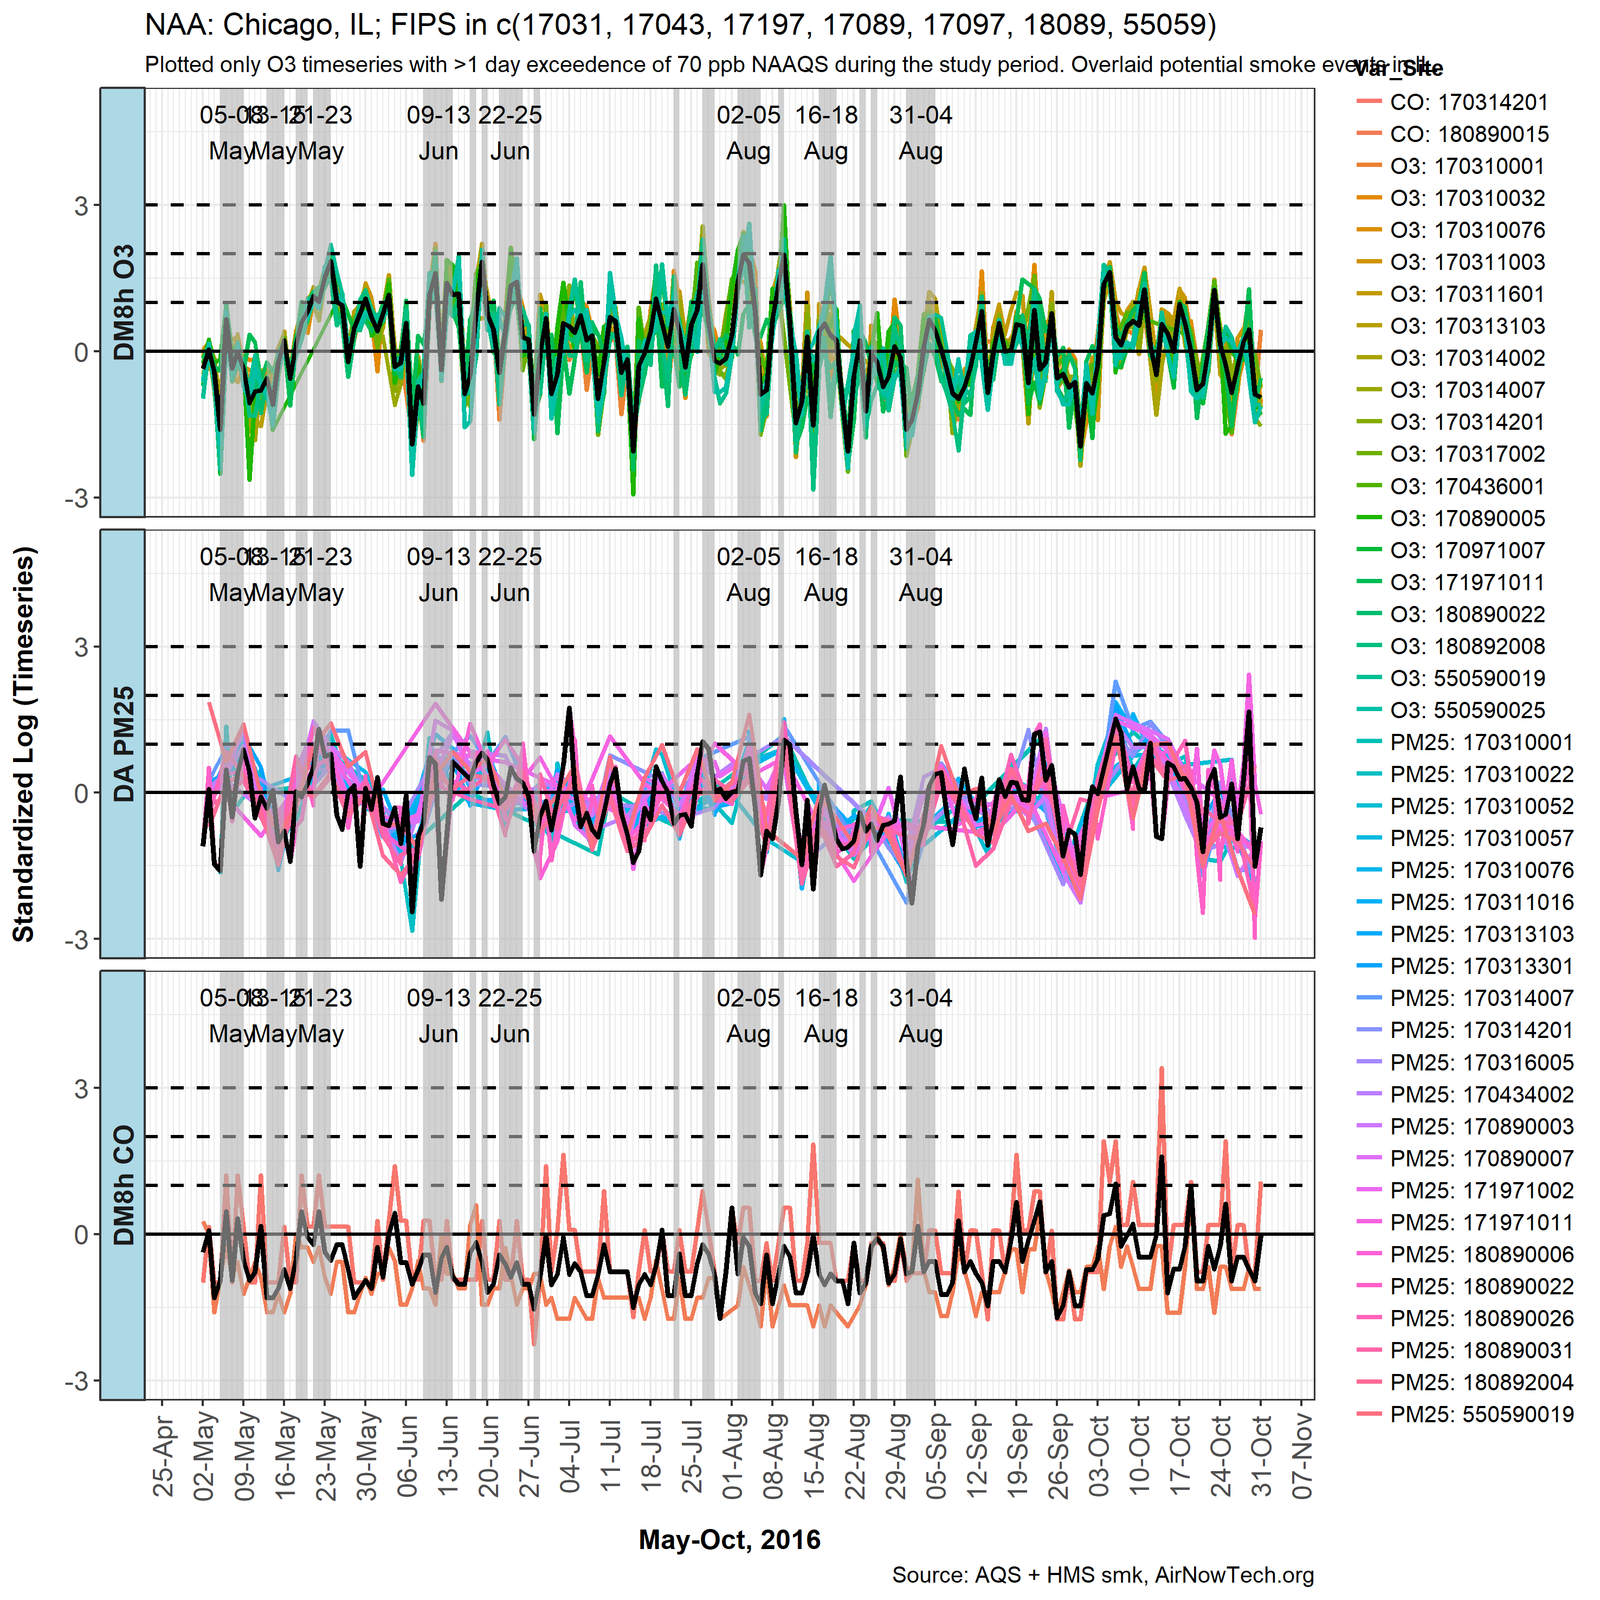
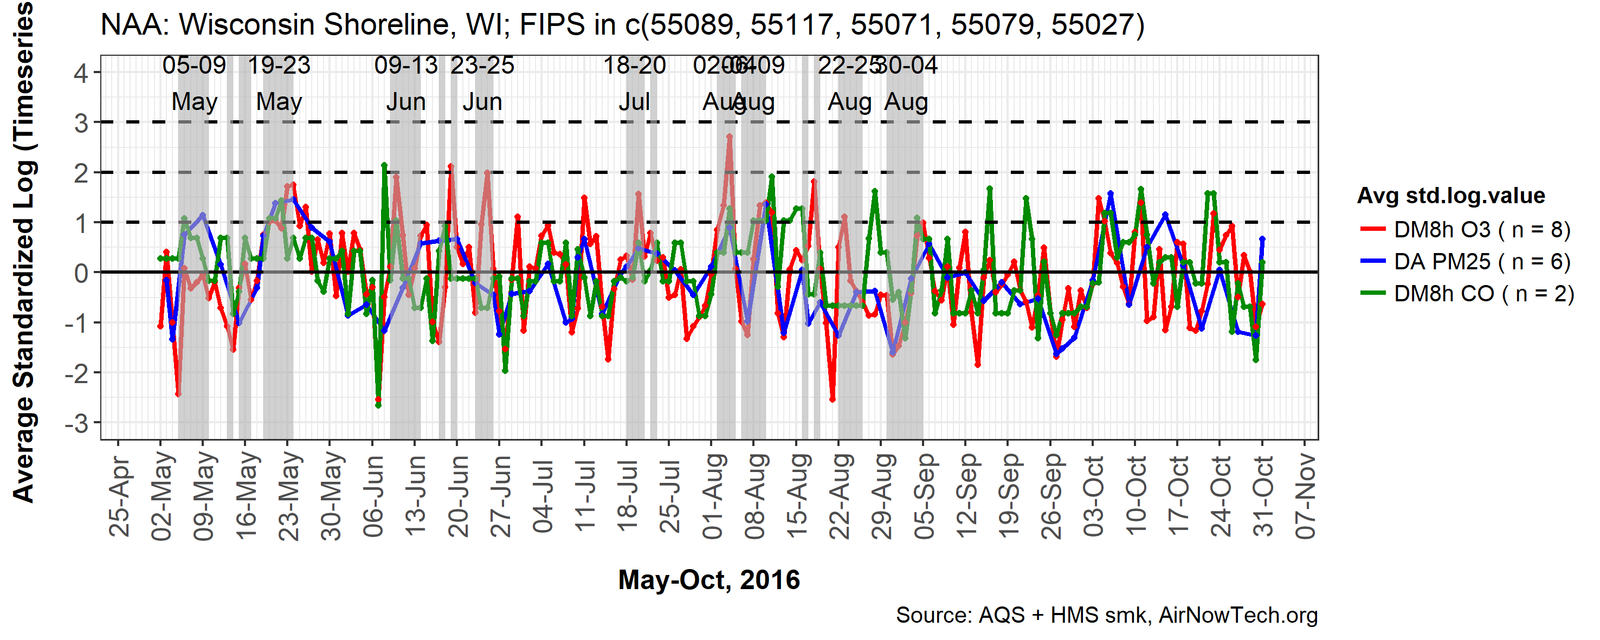
The LADCO Exceptional Event screening analysis focused on finding signals in standard surface monitoring data to identify when there is potential for smoke influences on surface air quality conditions during the ozone season (April 1 – October 31). We looked at associations between AQS observations of daily maximum 8-hour ozone (DM8h O3) and daily maximum 8-hour average CO (DM8h CO); and CASTNet daily average total PM2.5 (DA PM25). Our hypothesis is that coincident peaks in all three of these pollutants may indicate smoke influence in a non-attainment area (NAA).
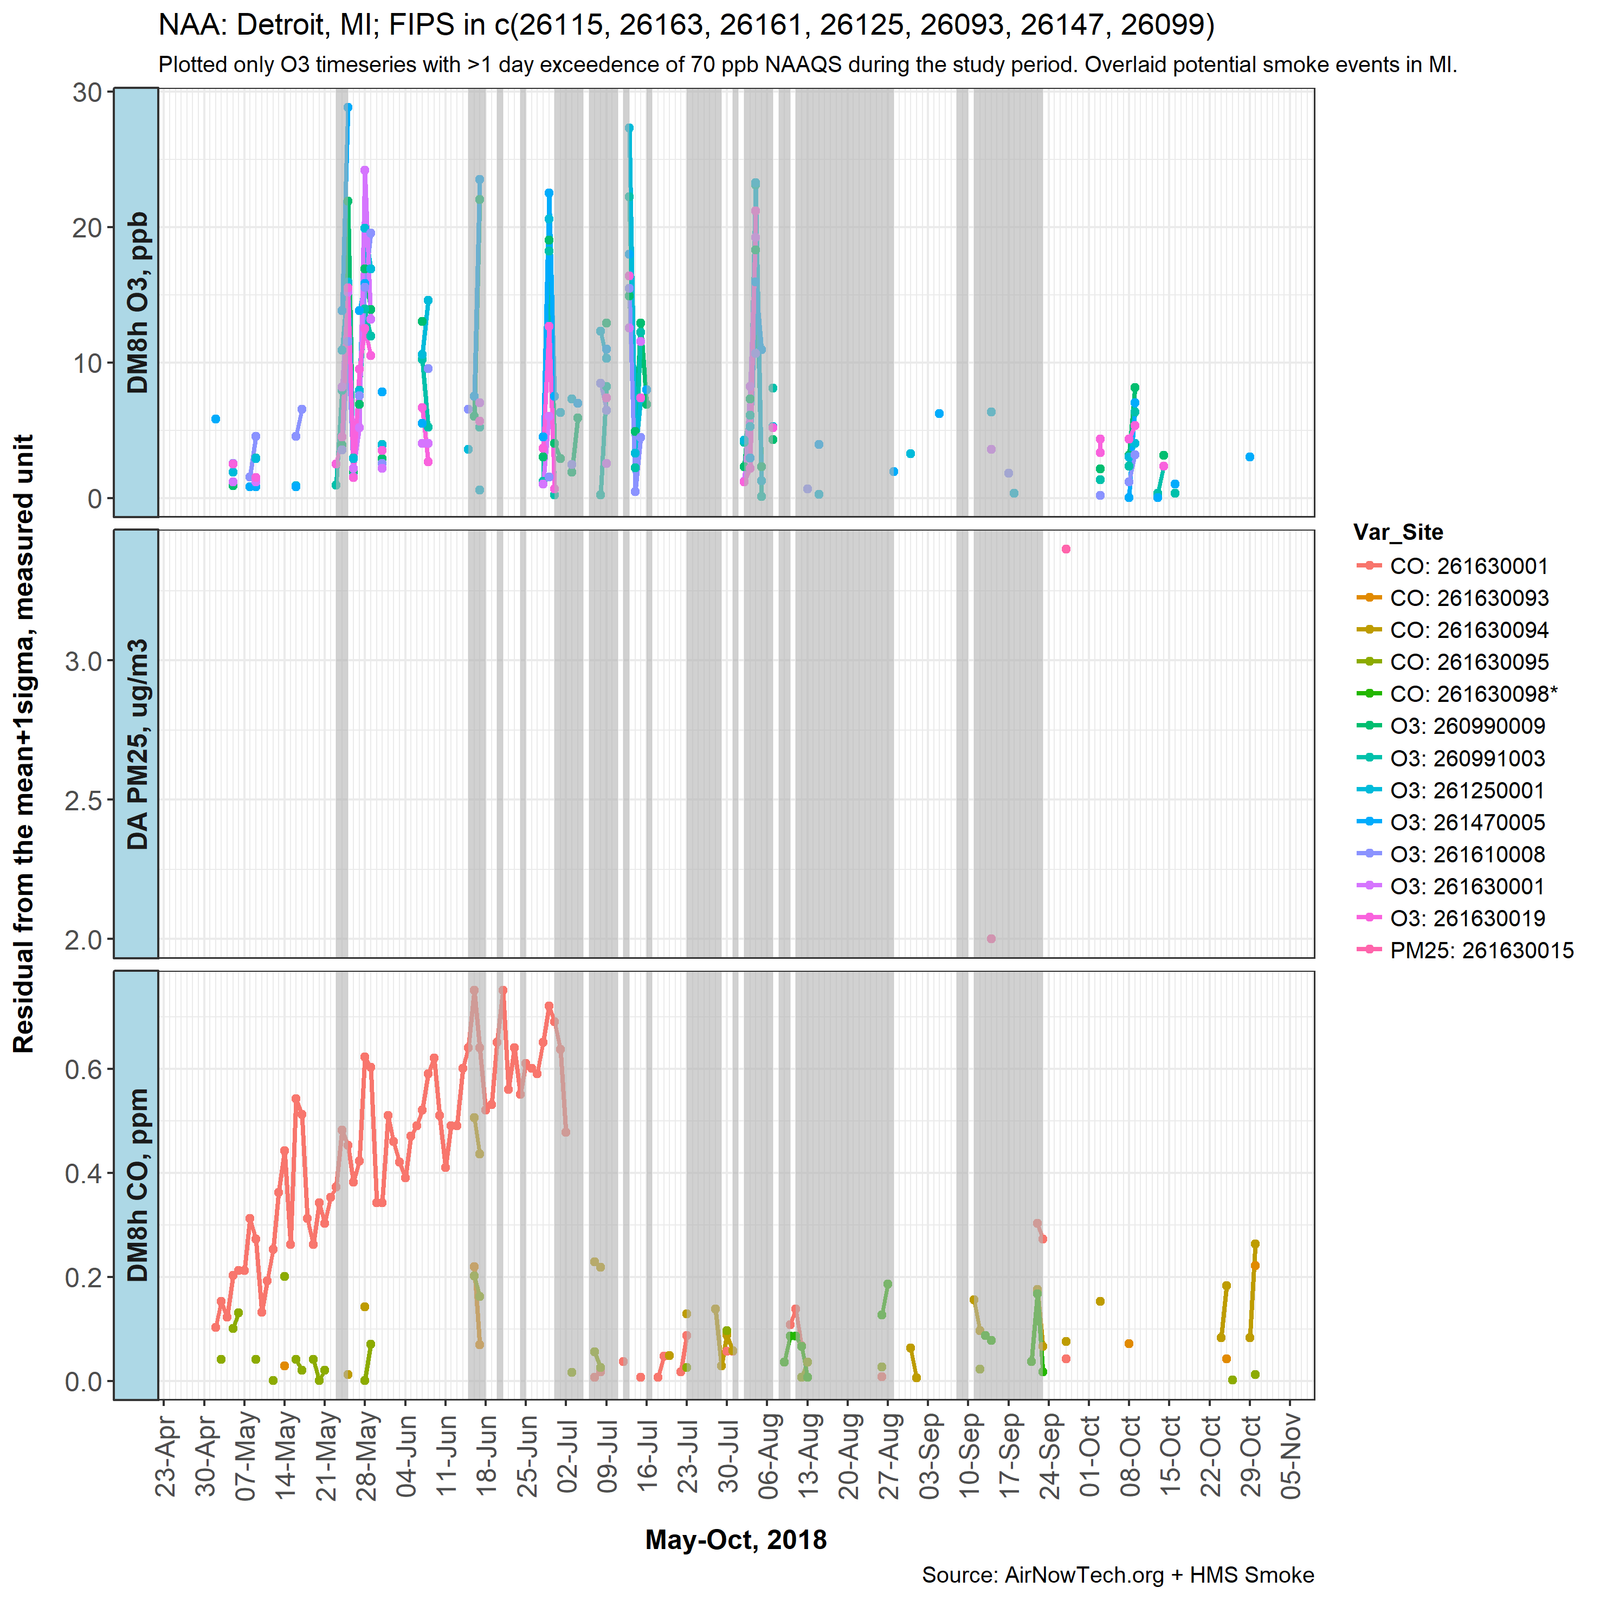
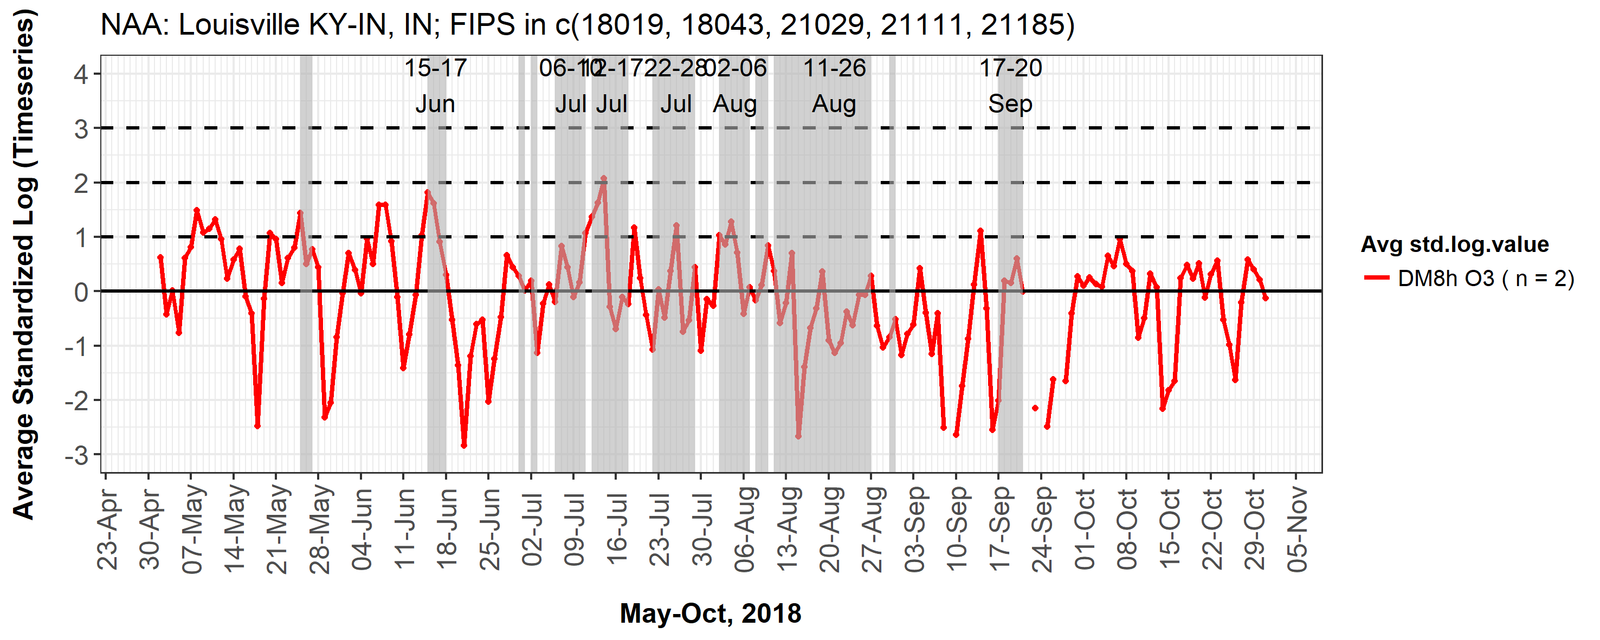
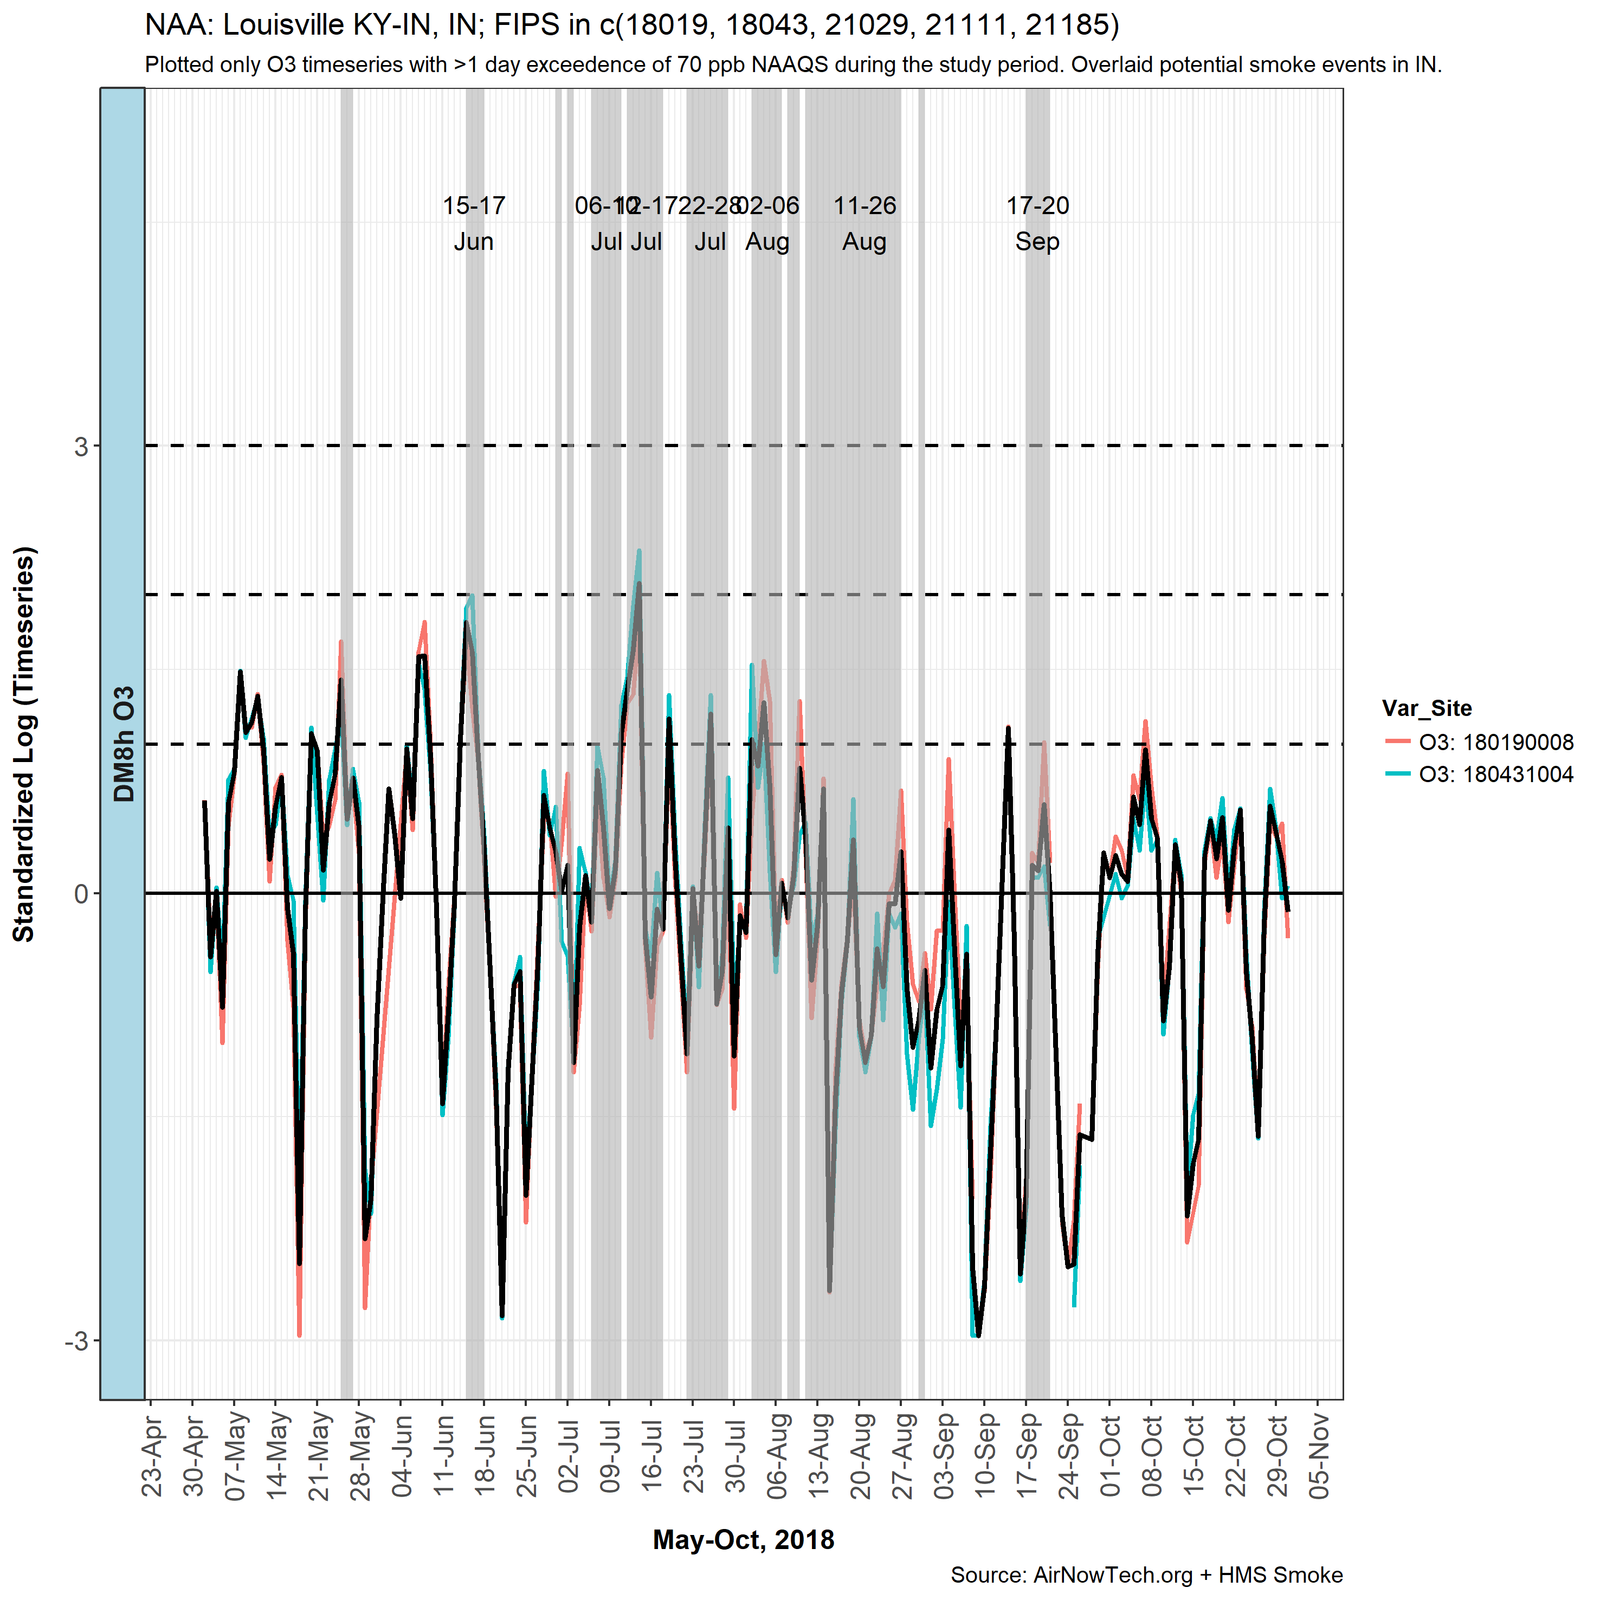
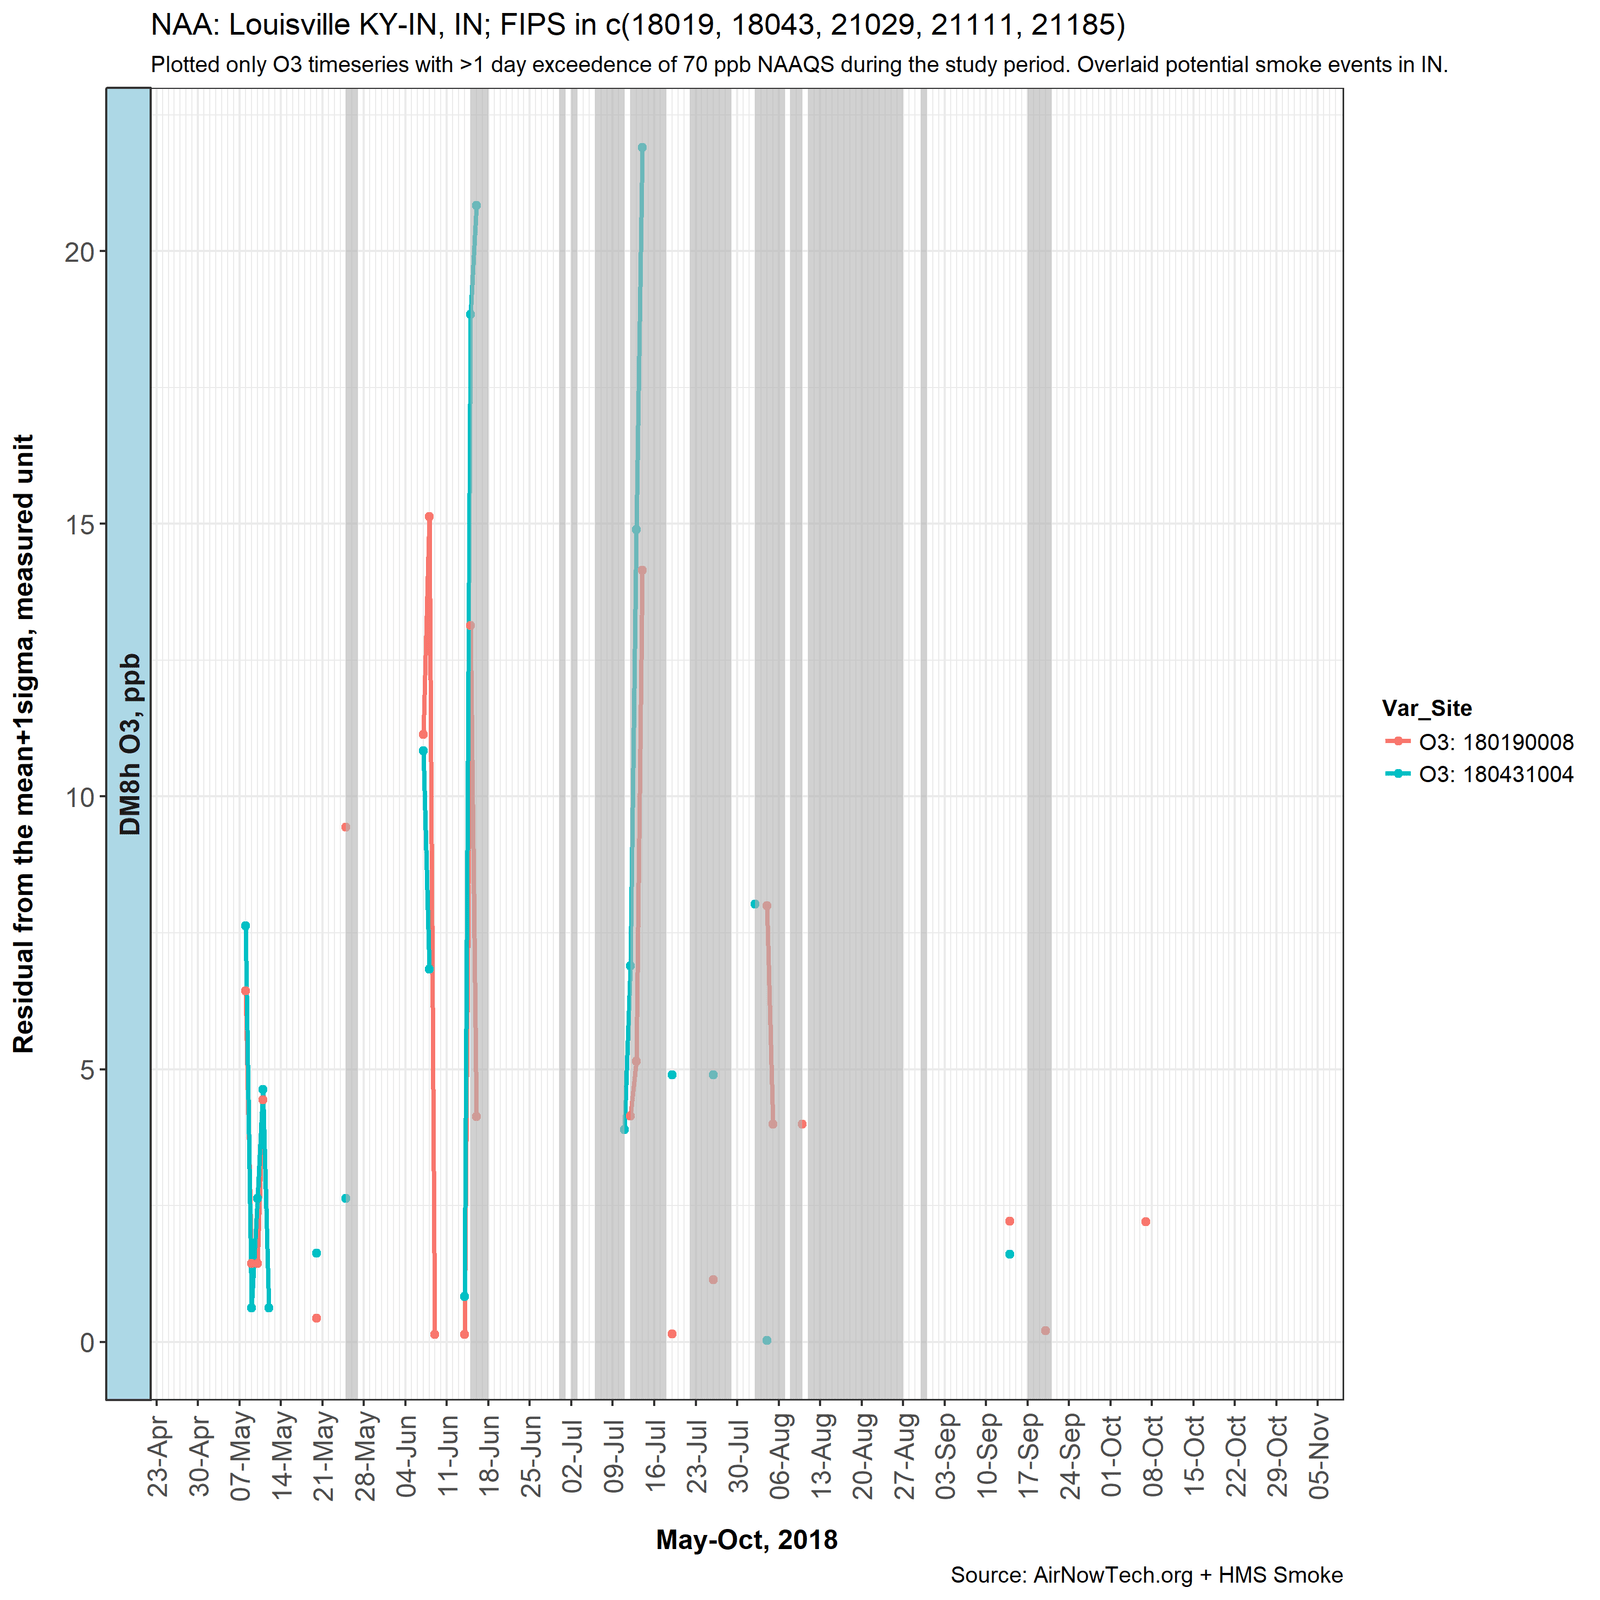
For each region of interest (e.g., 2015 O3 NAAQS NAA) we display three plots:
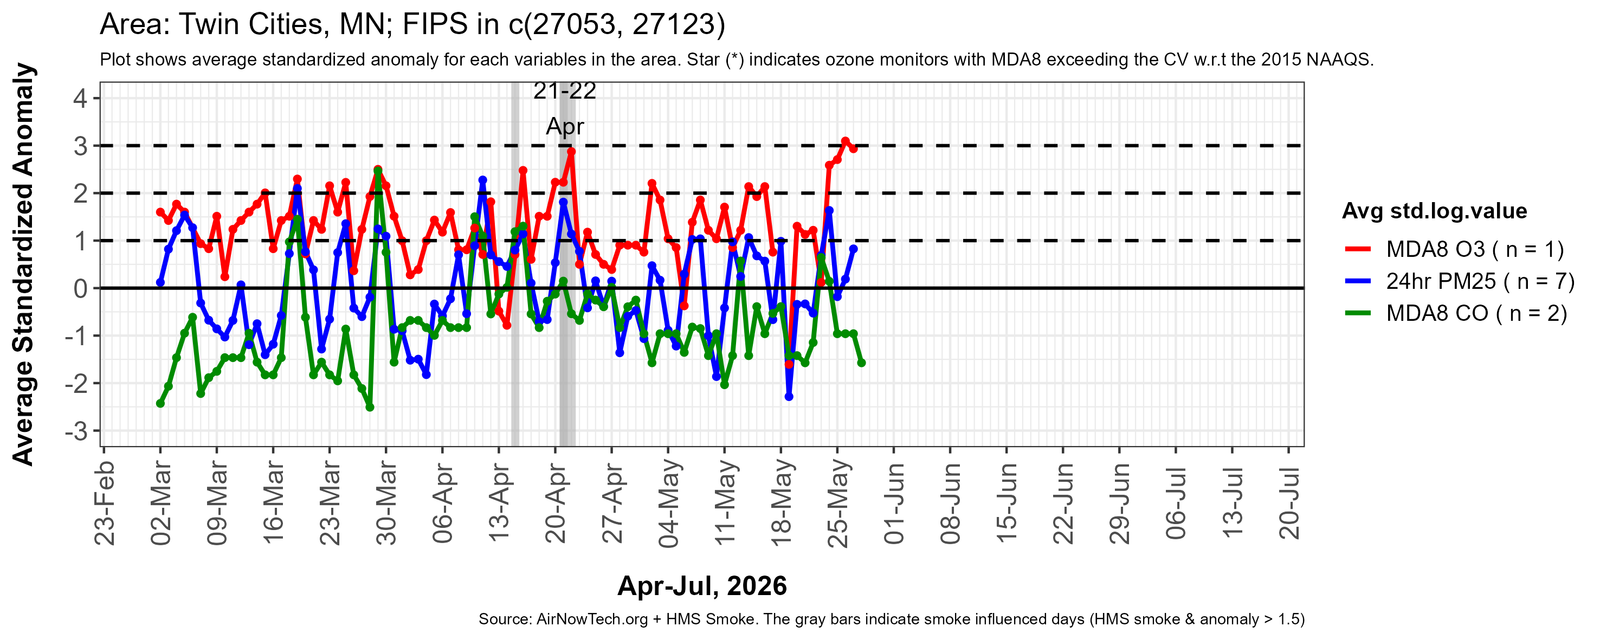
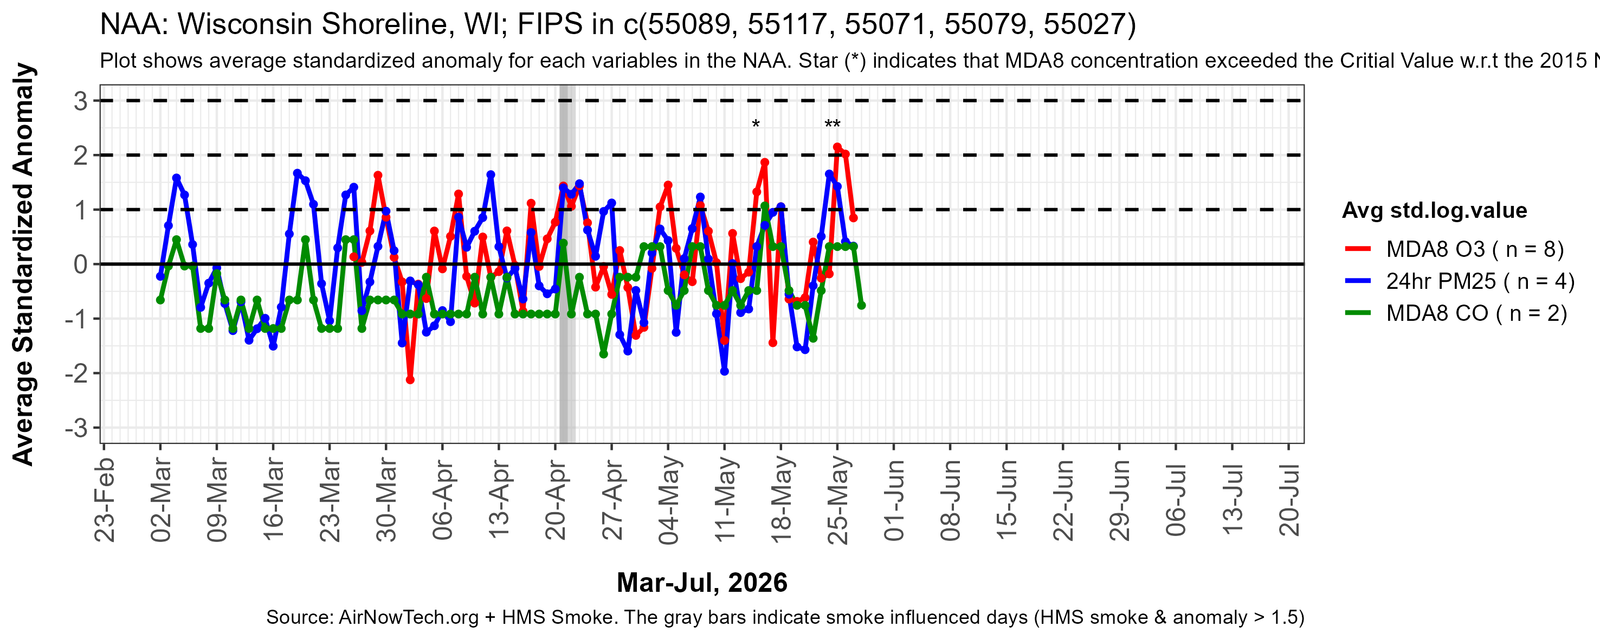
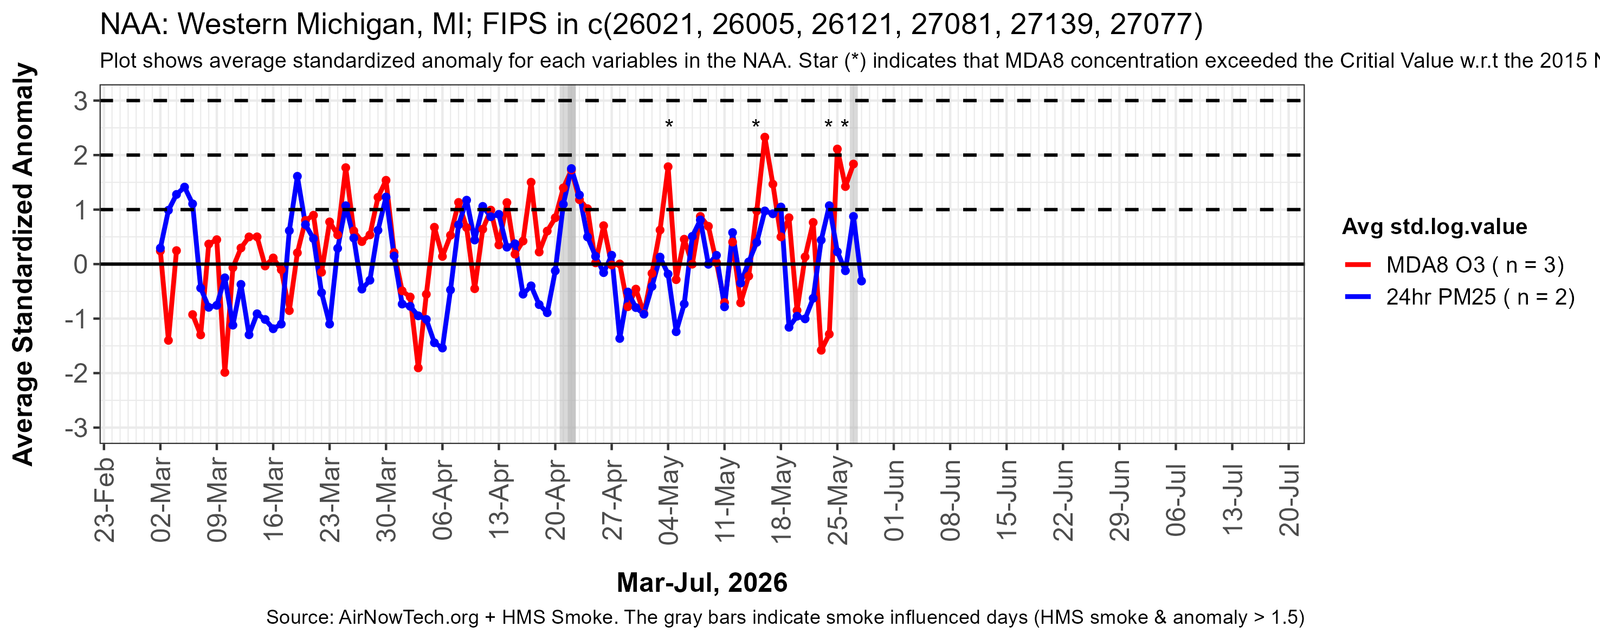
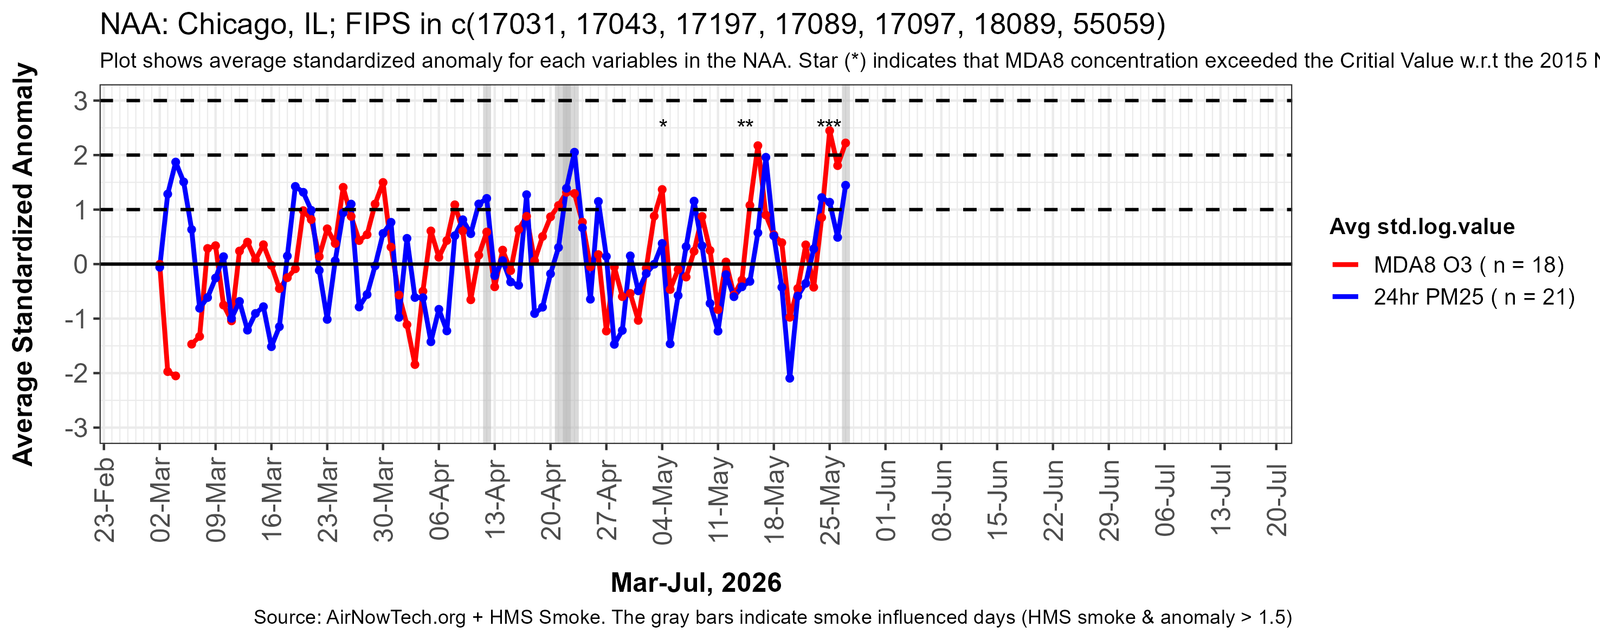
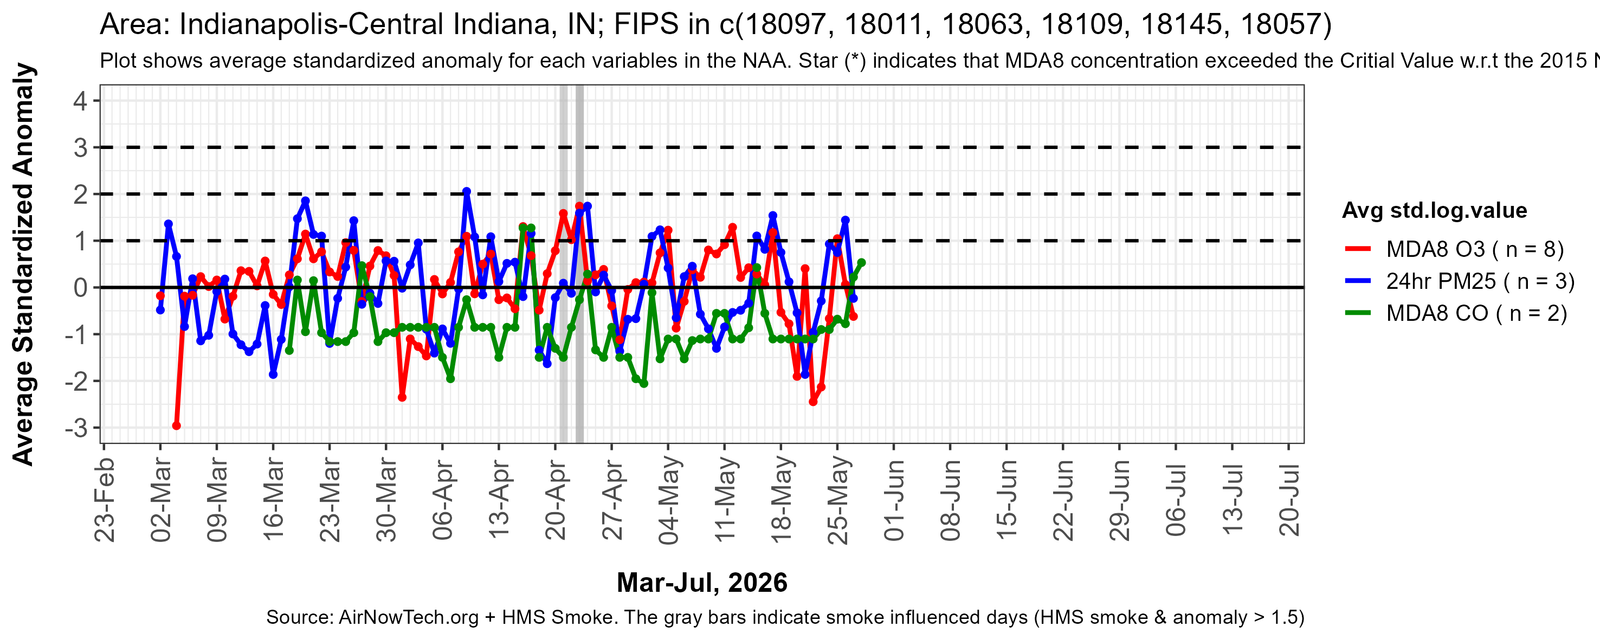
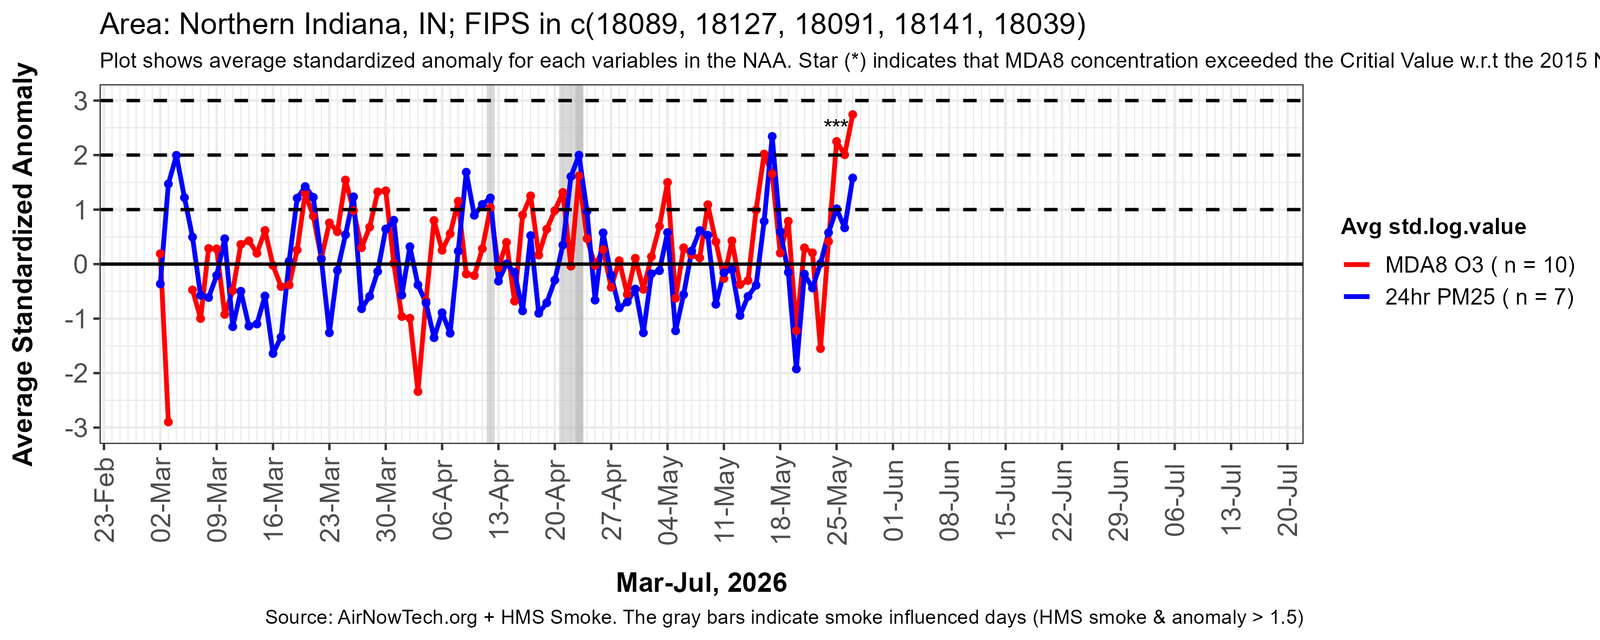
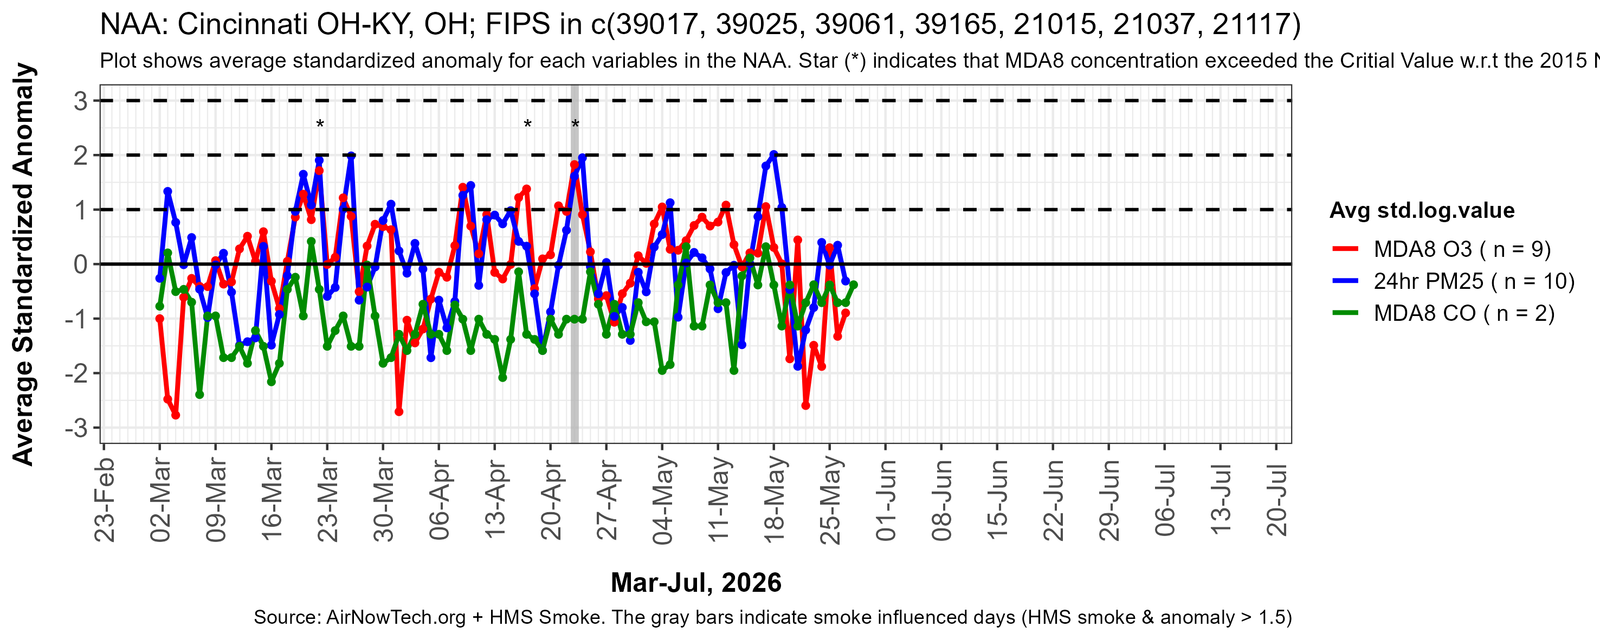
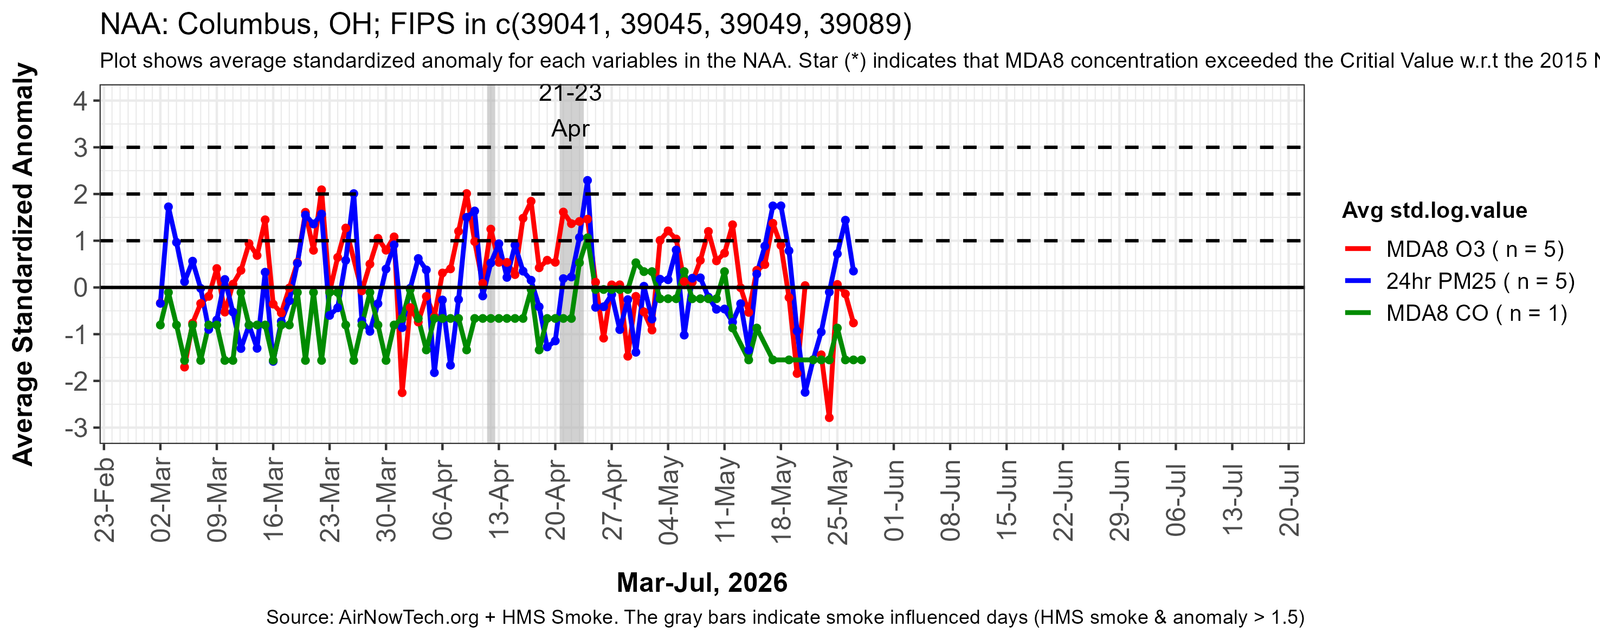
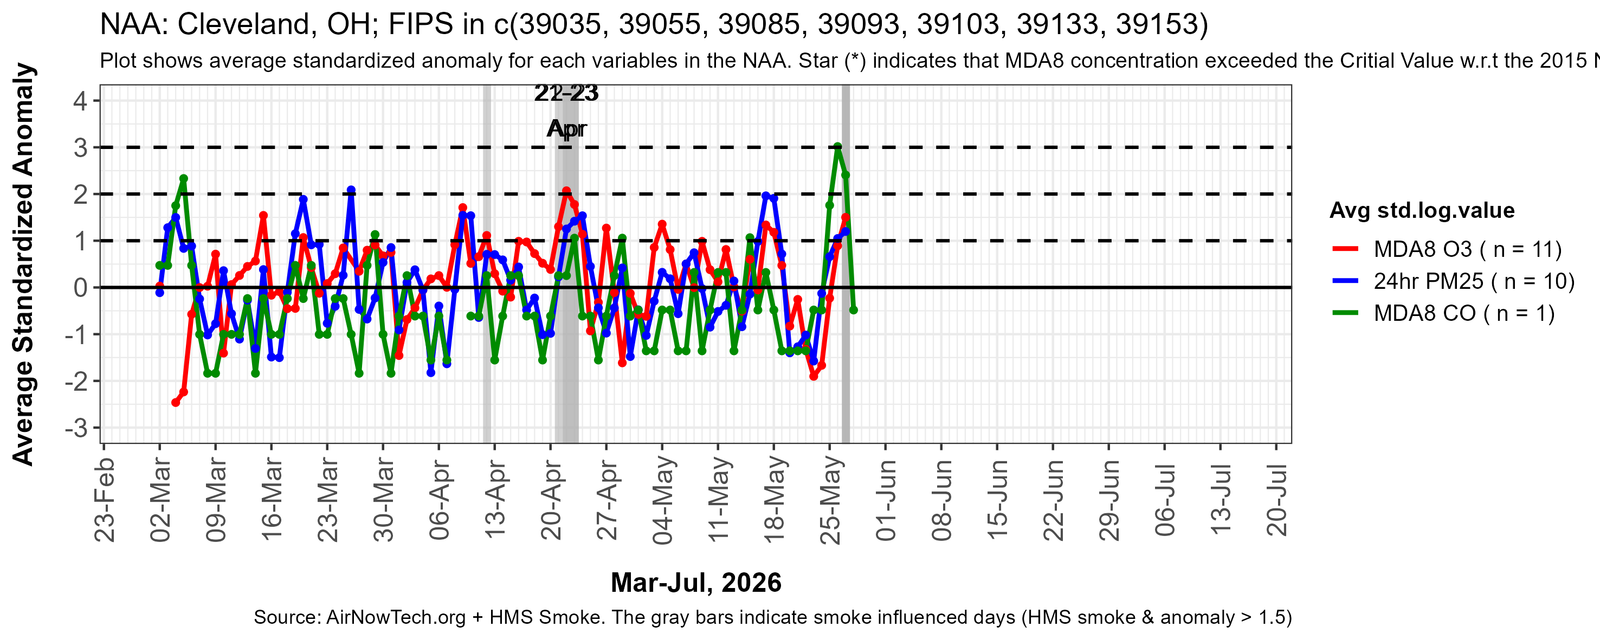
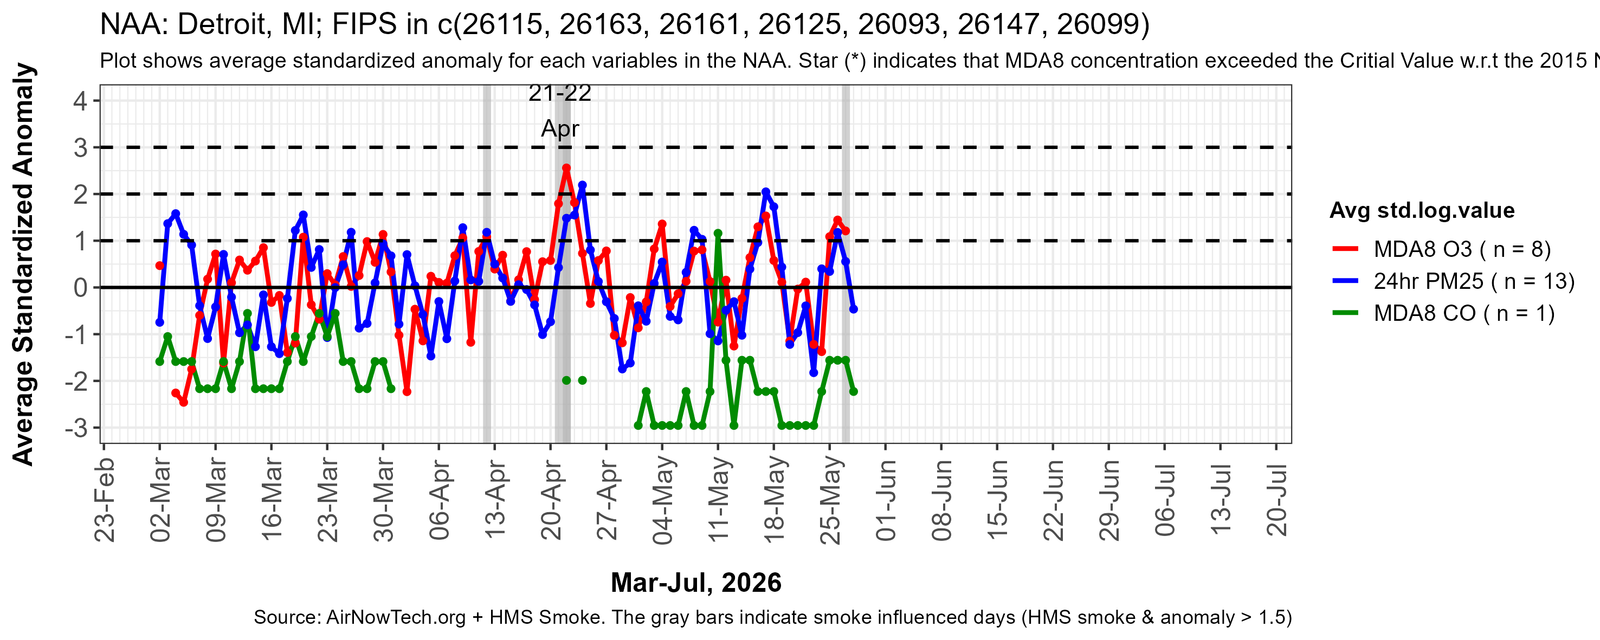
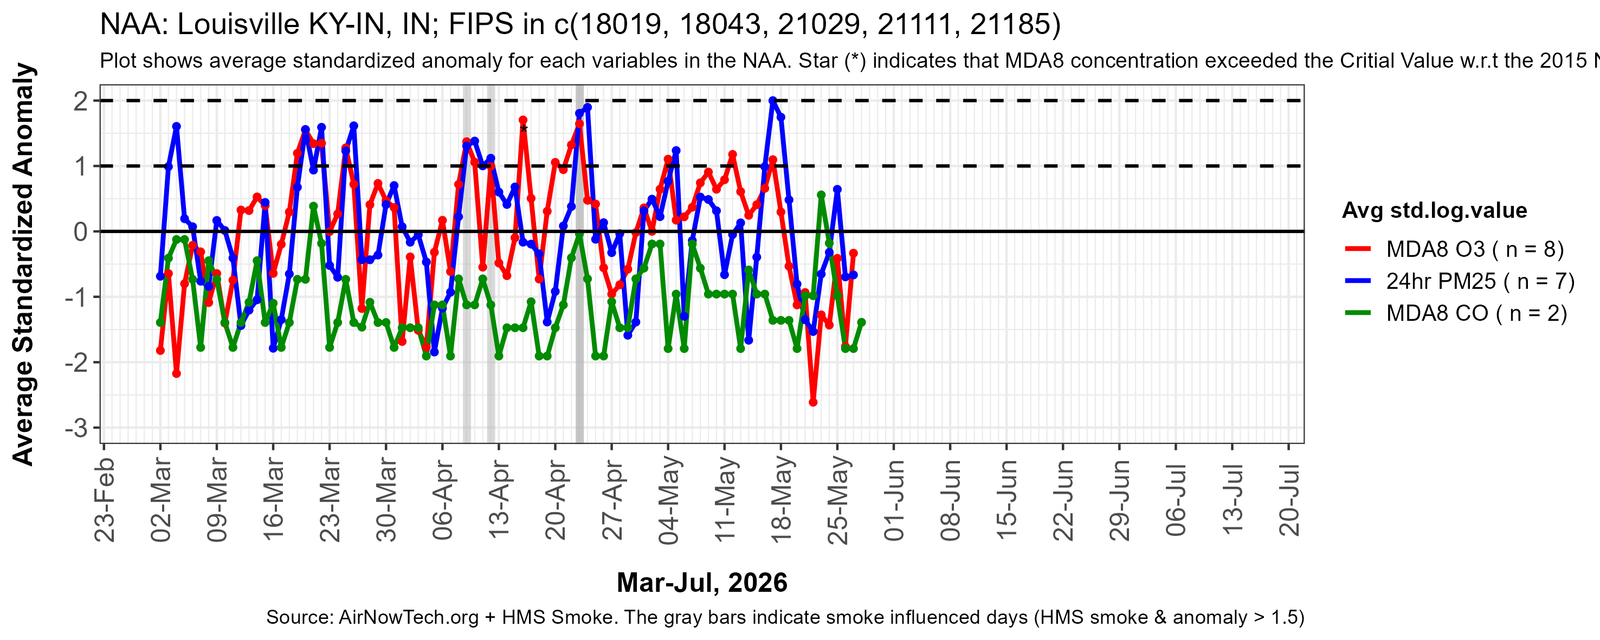
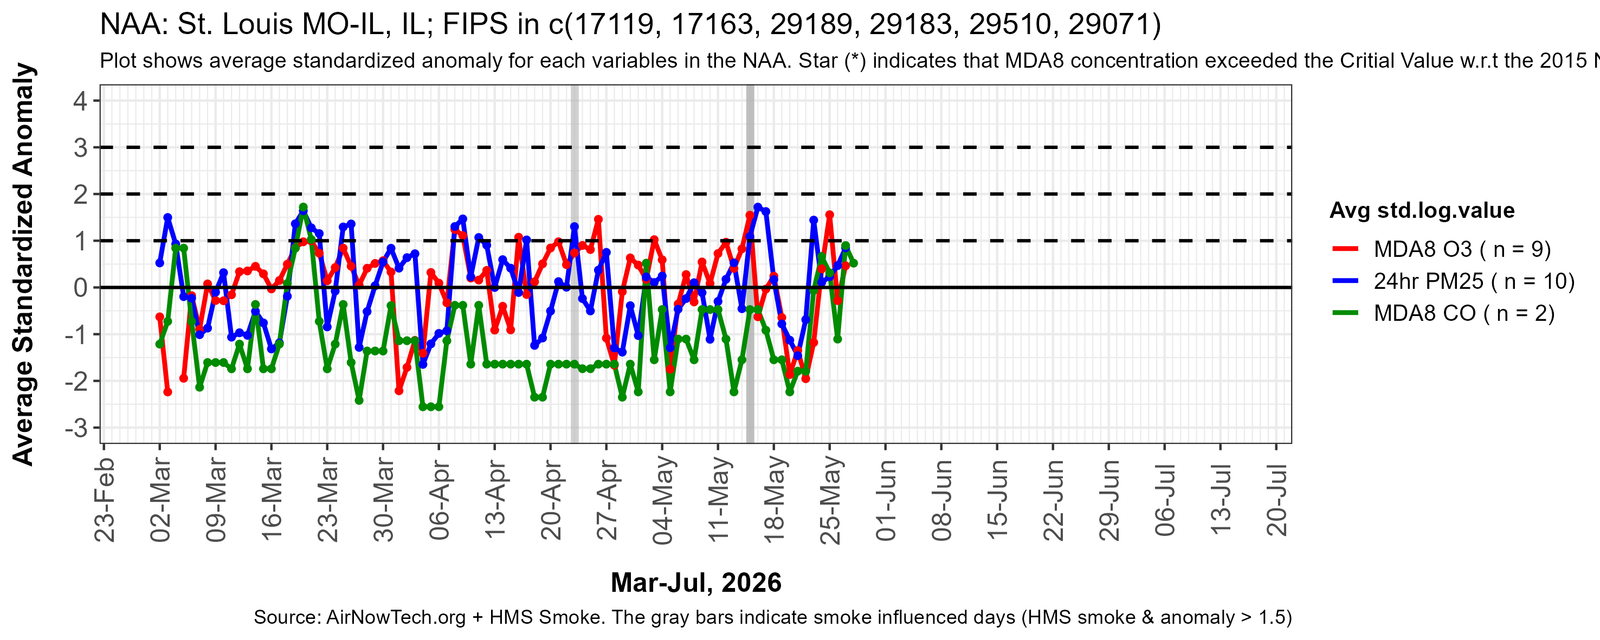
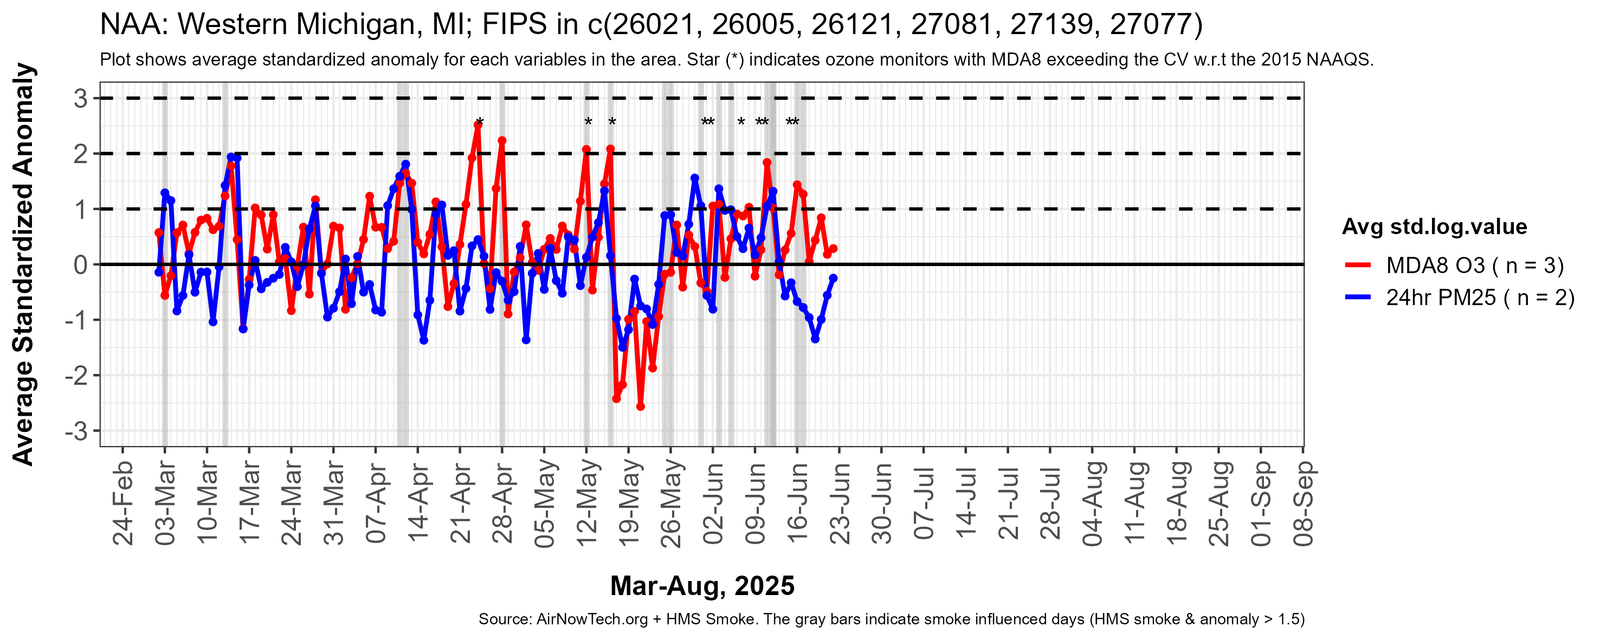
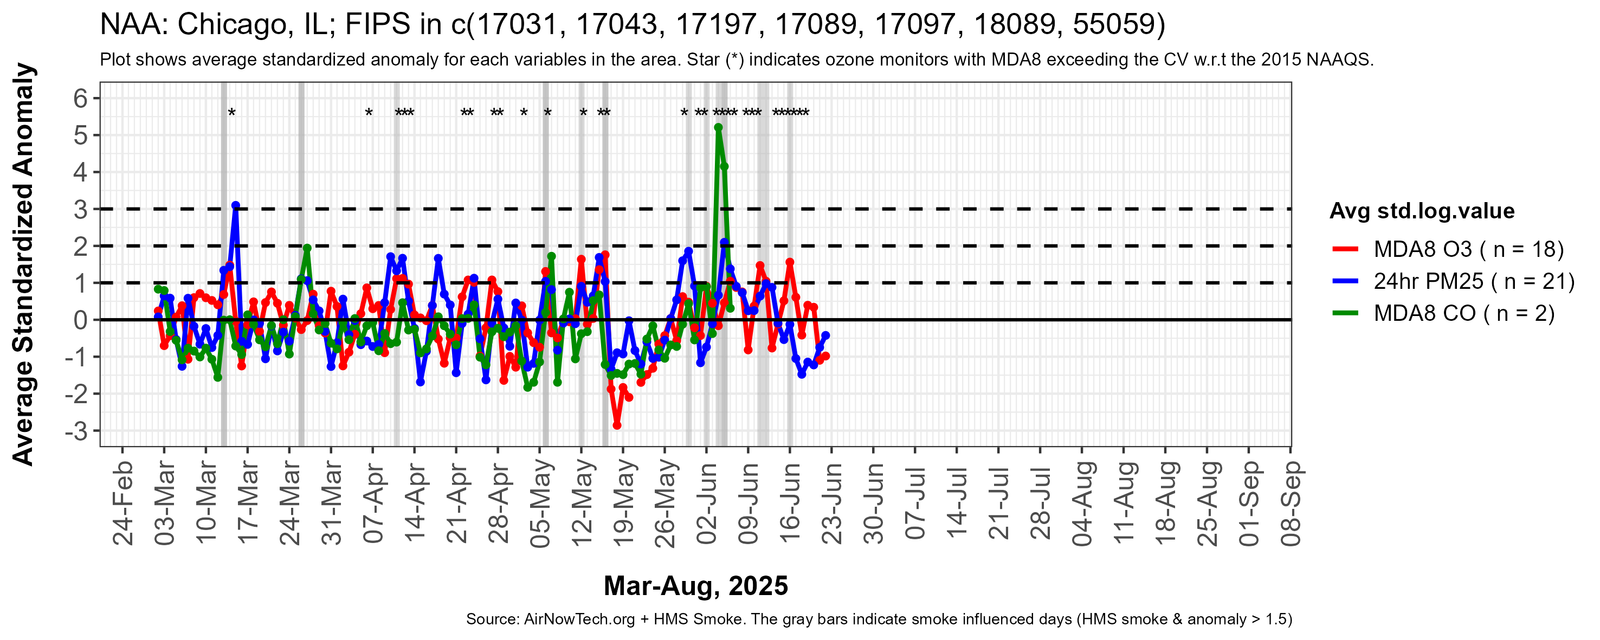
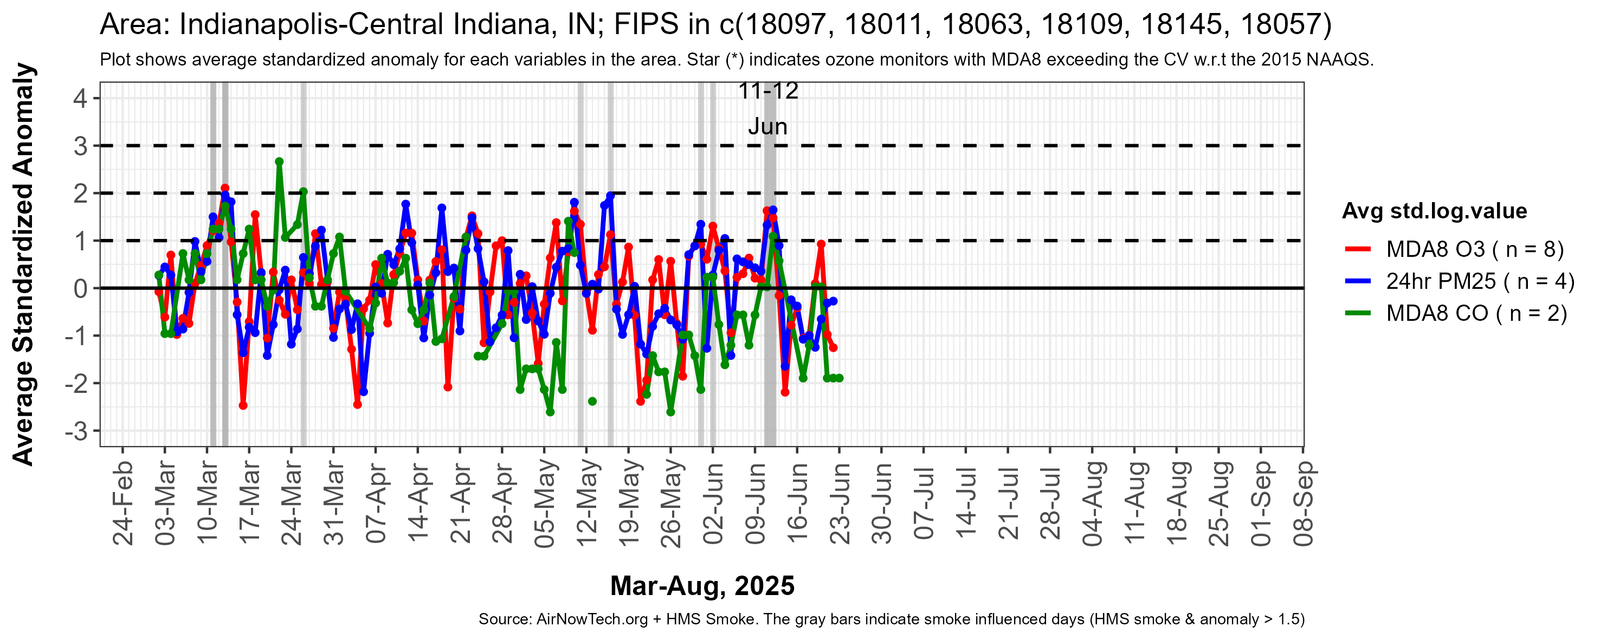
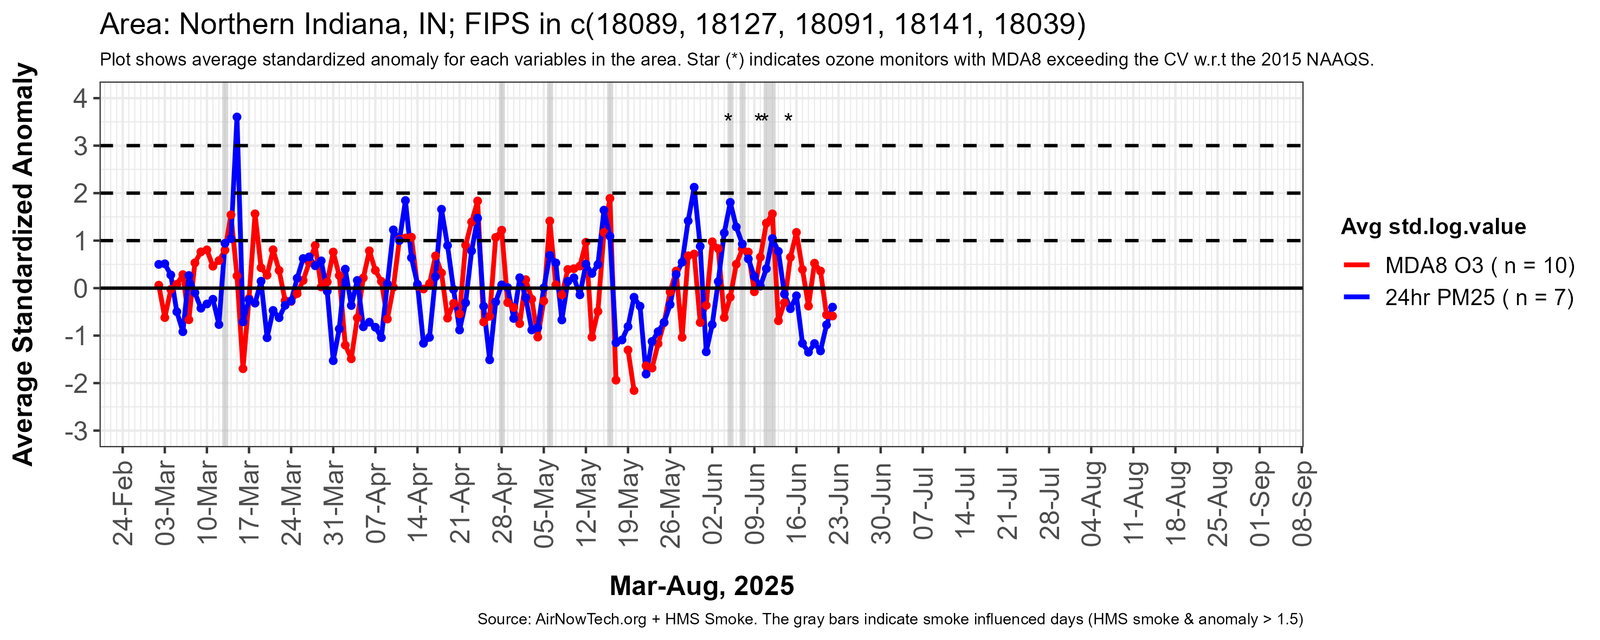
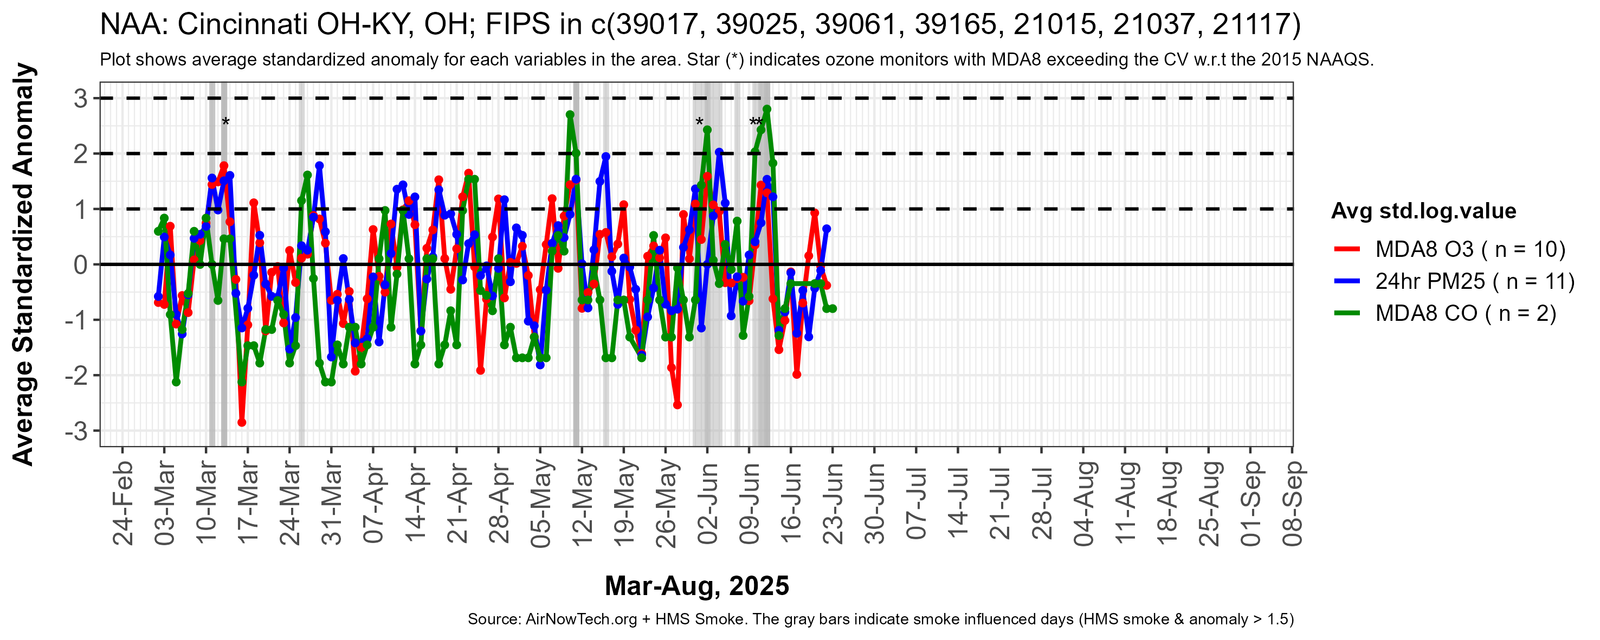
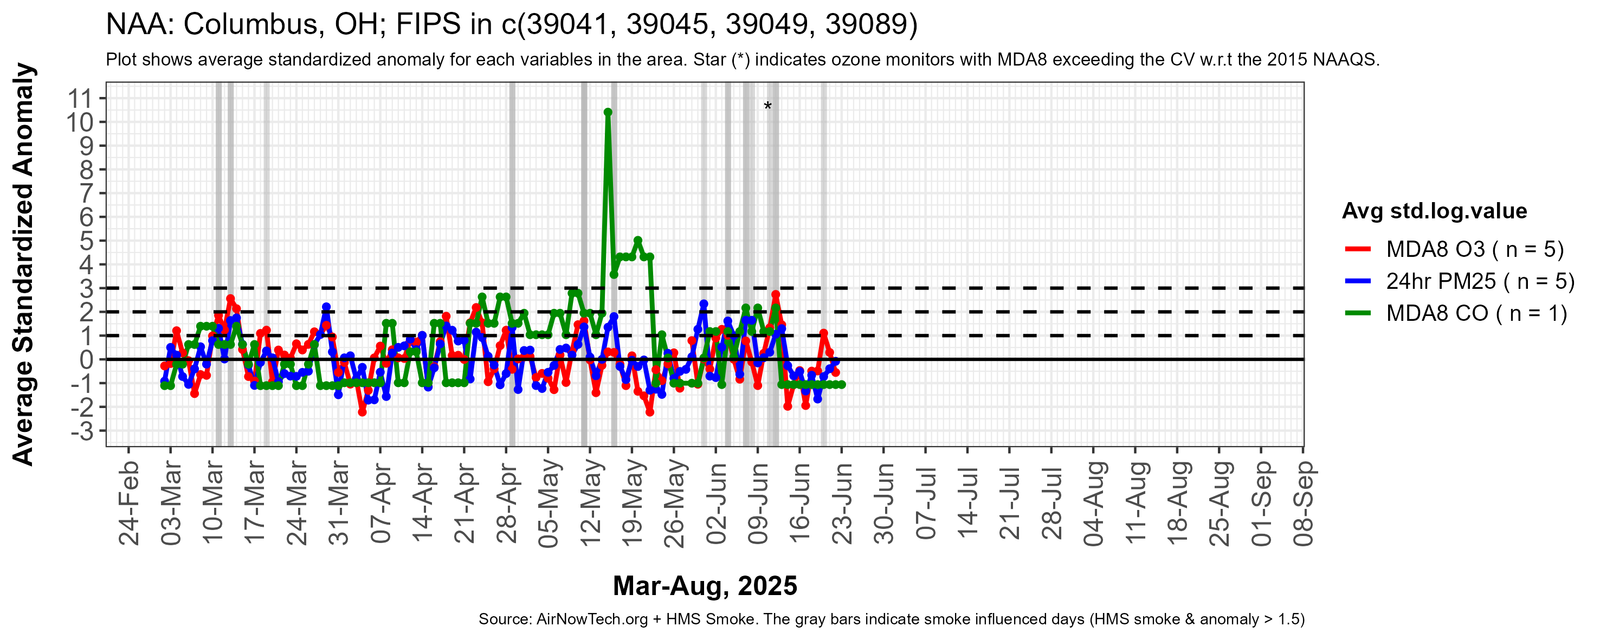
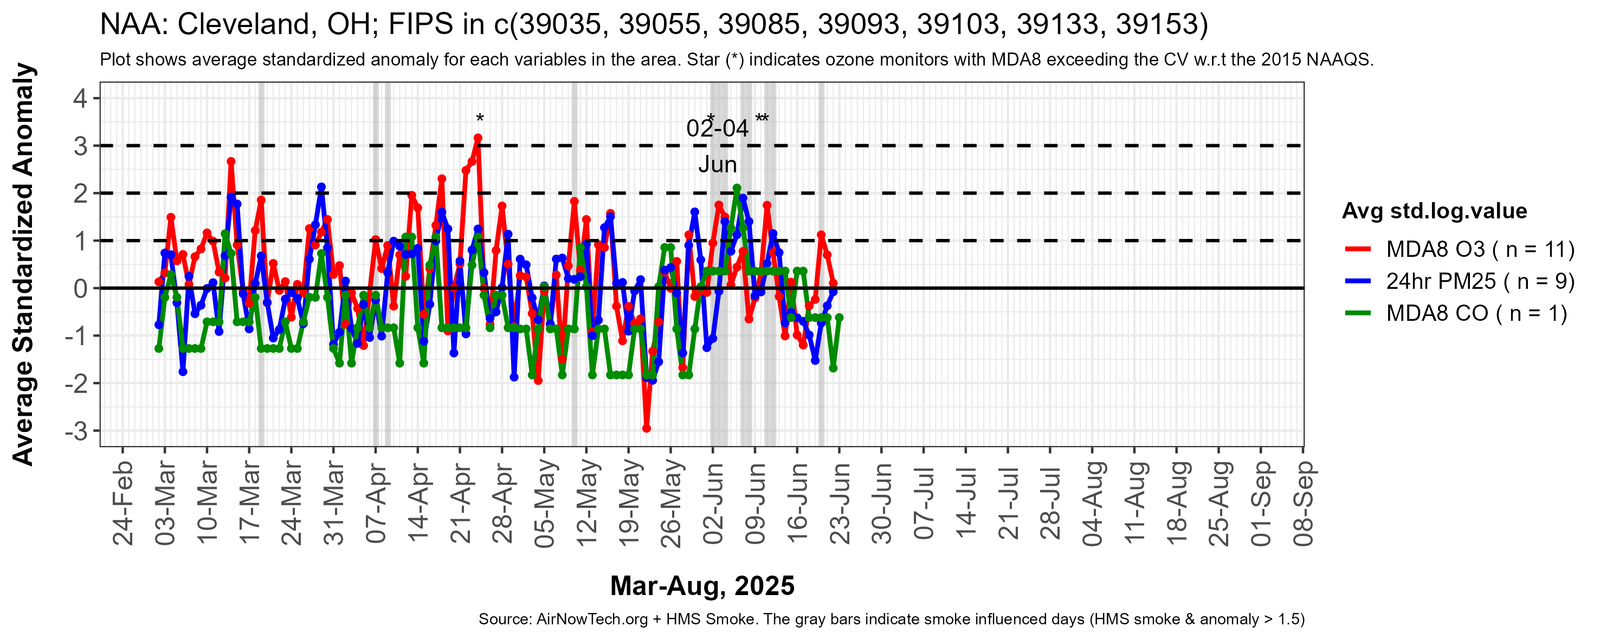
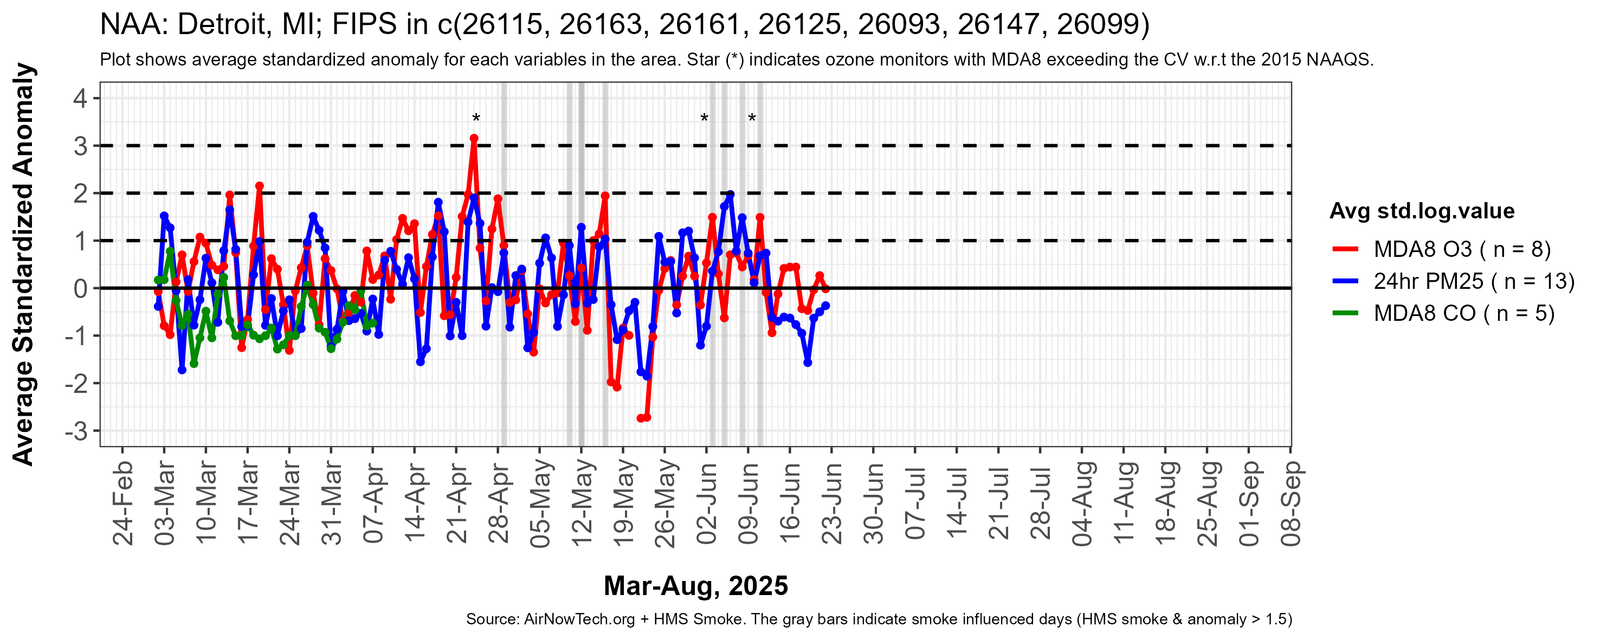
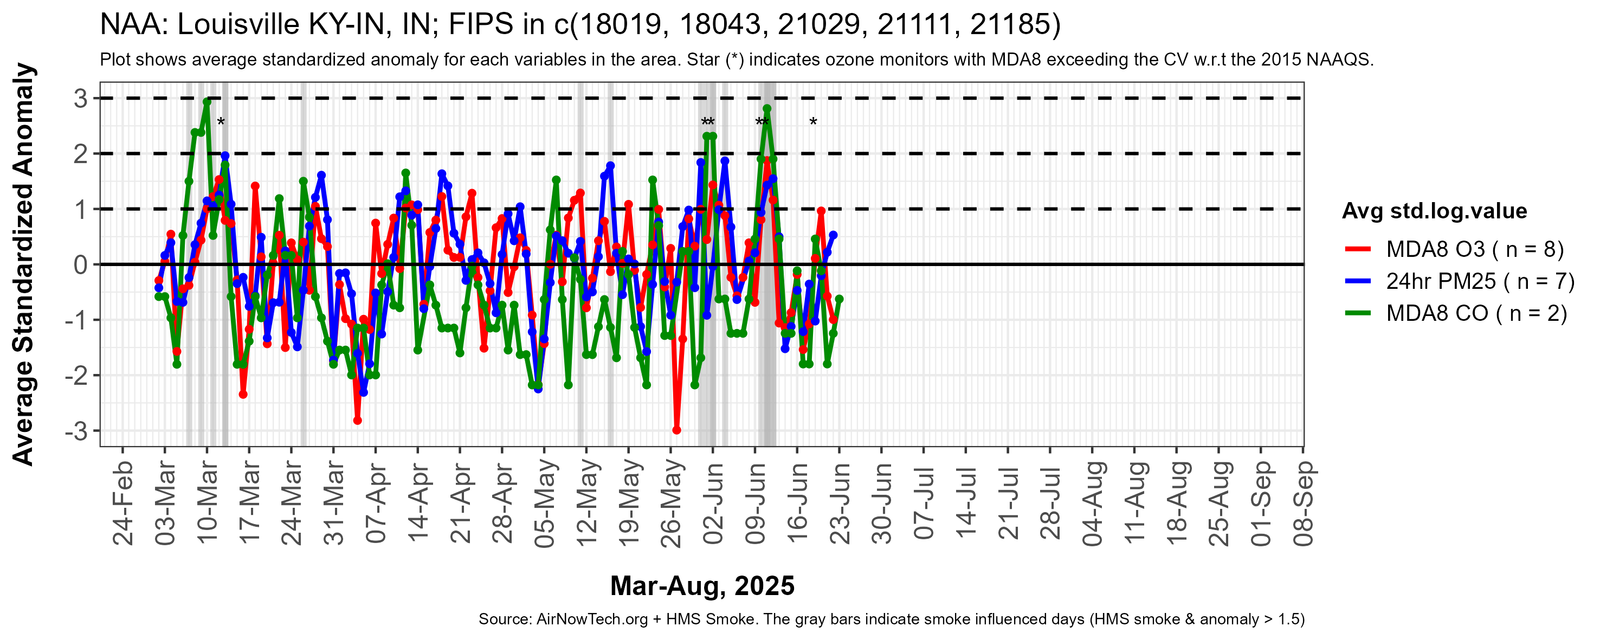
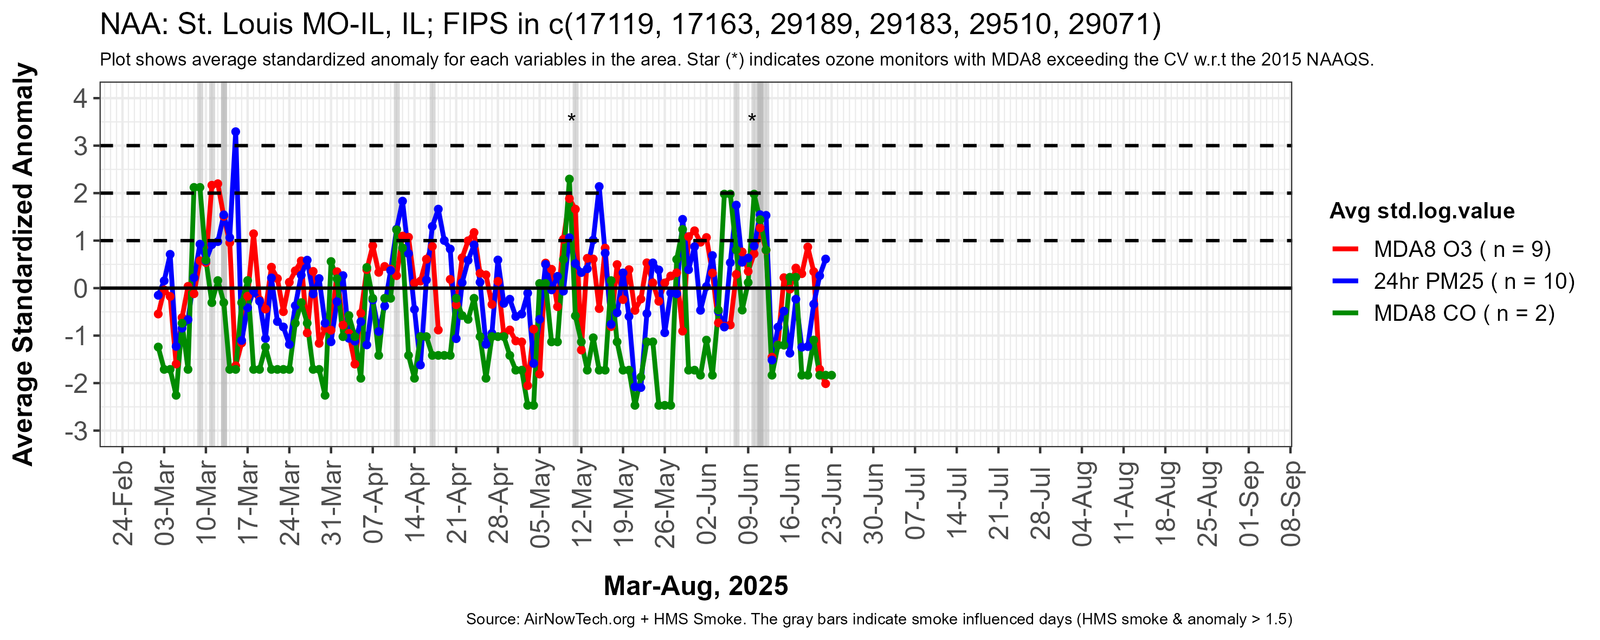
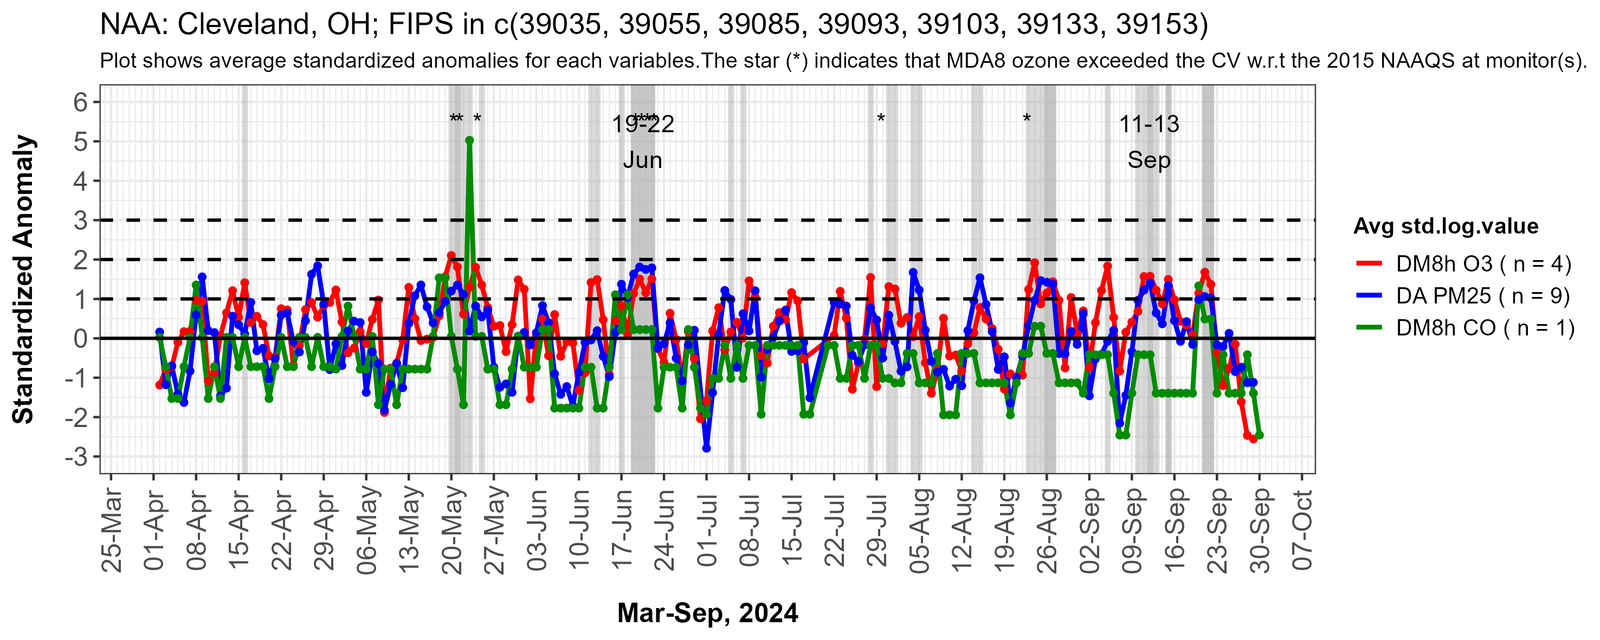
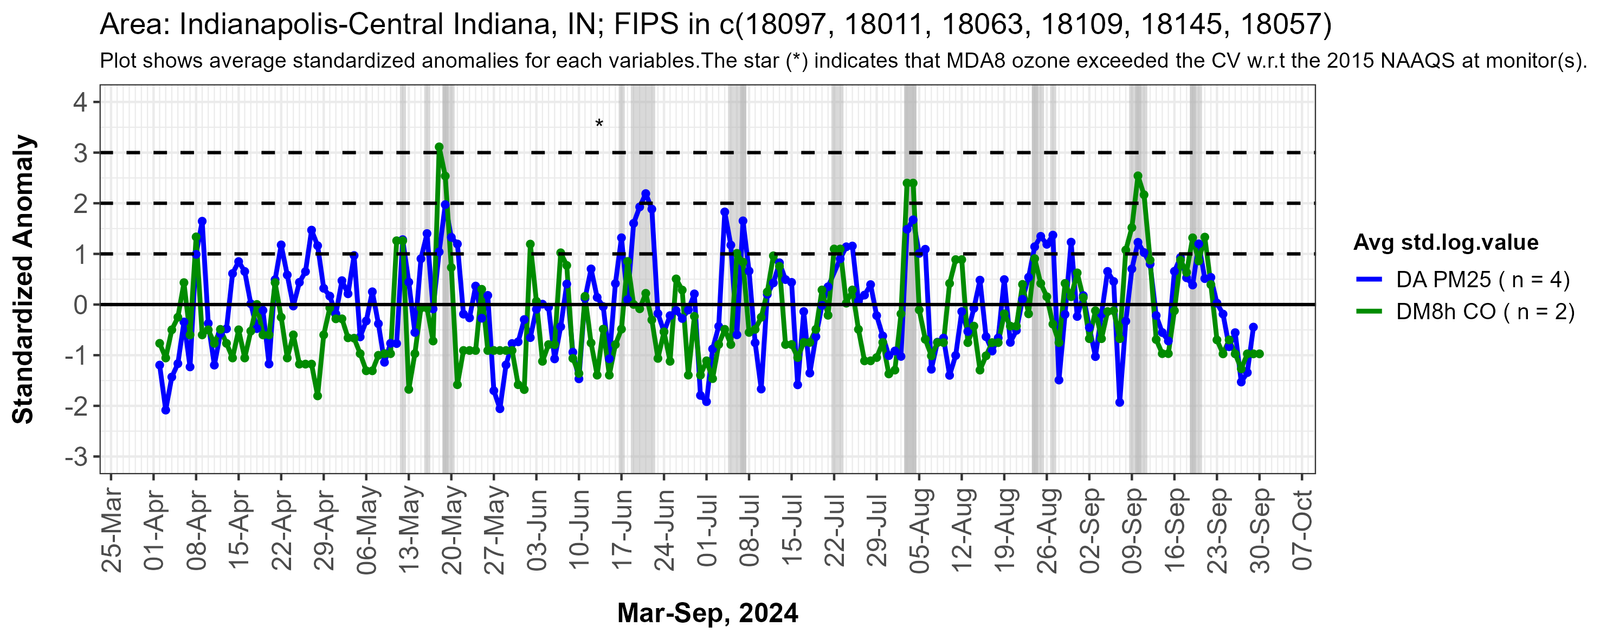
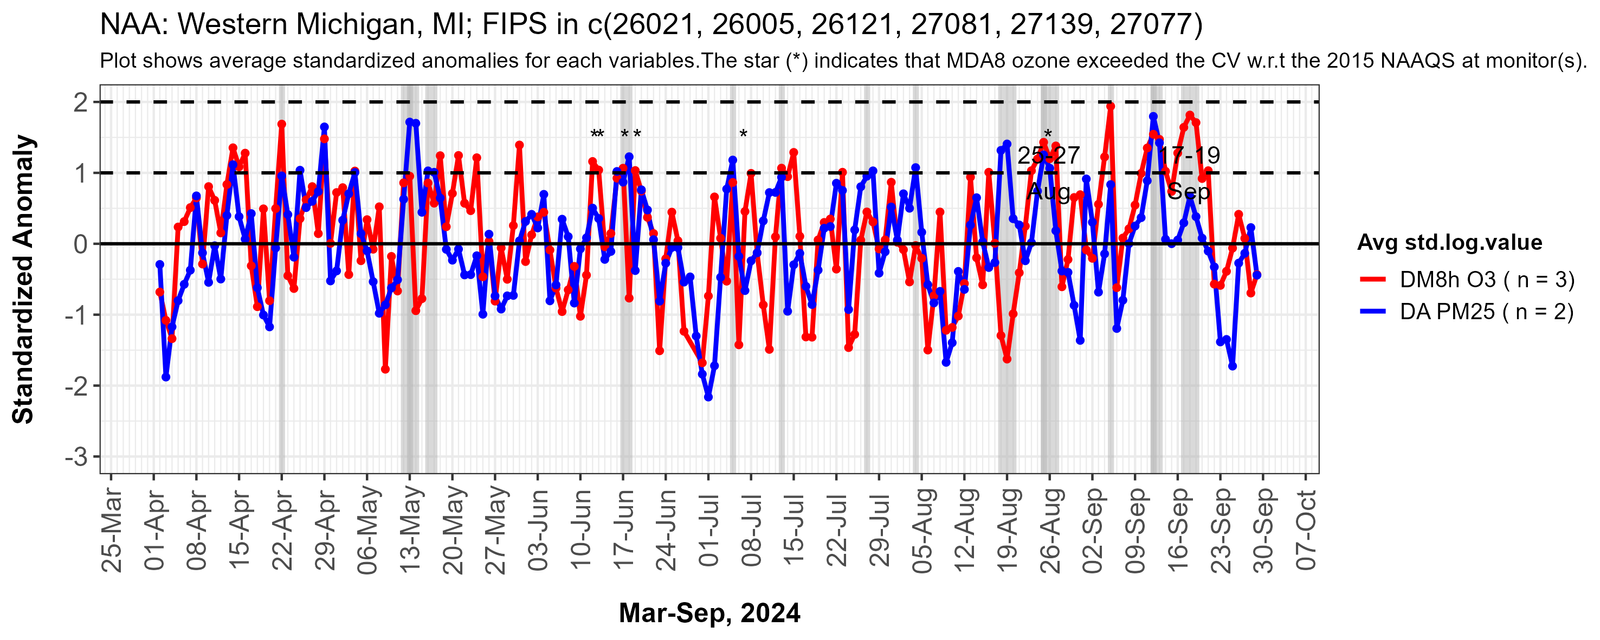
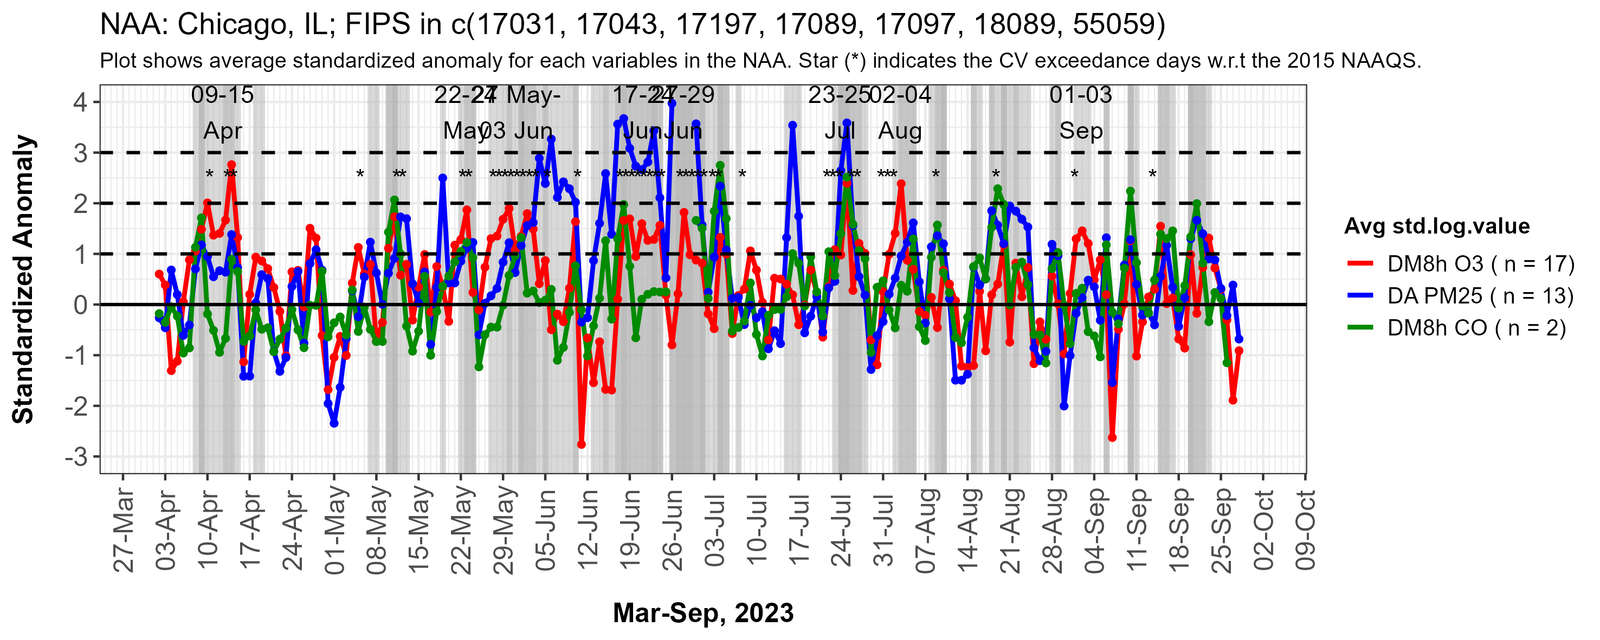
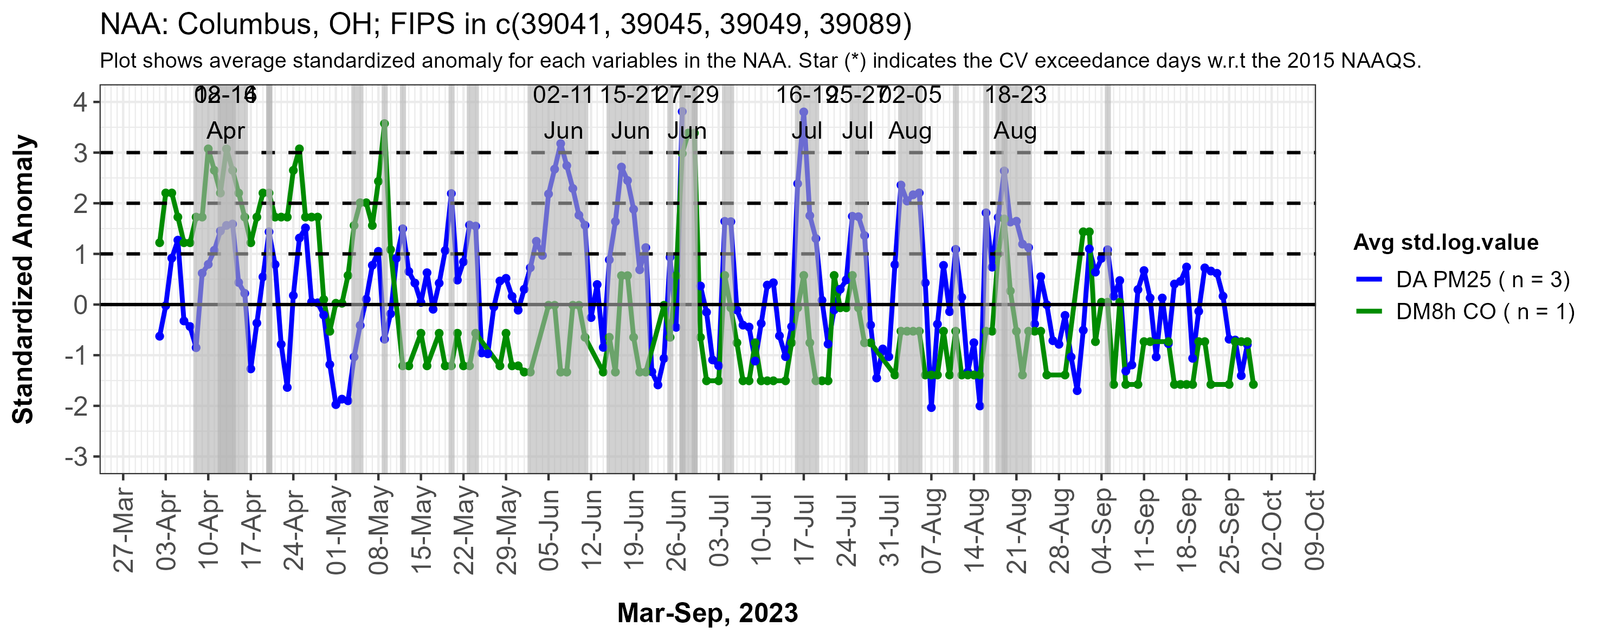
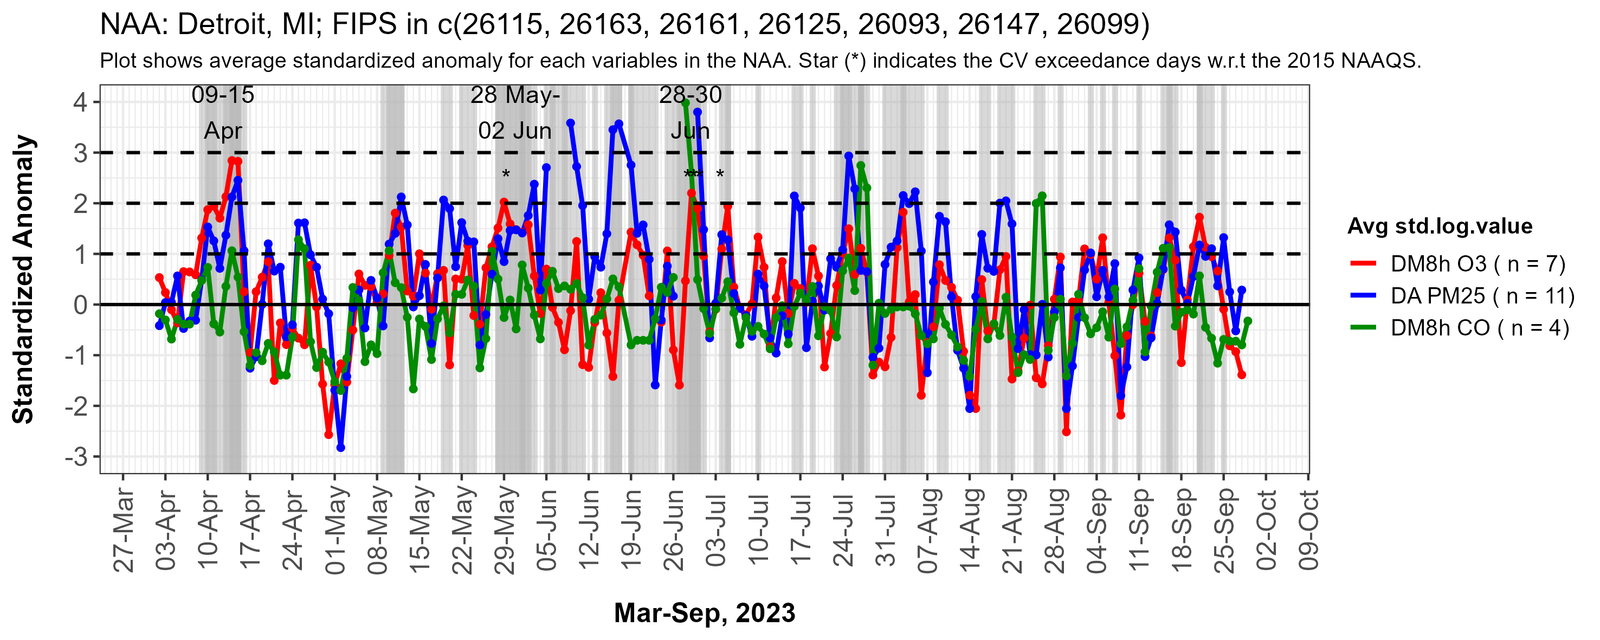
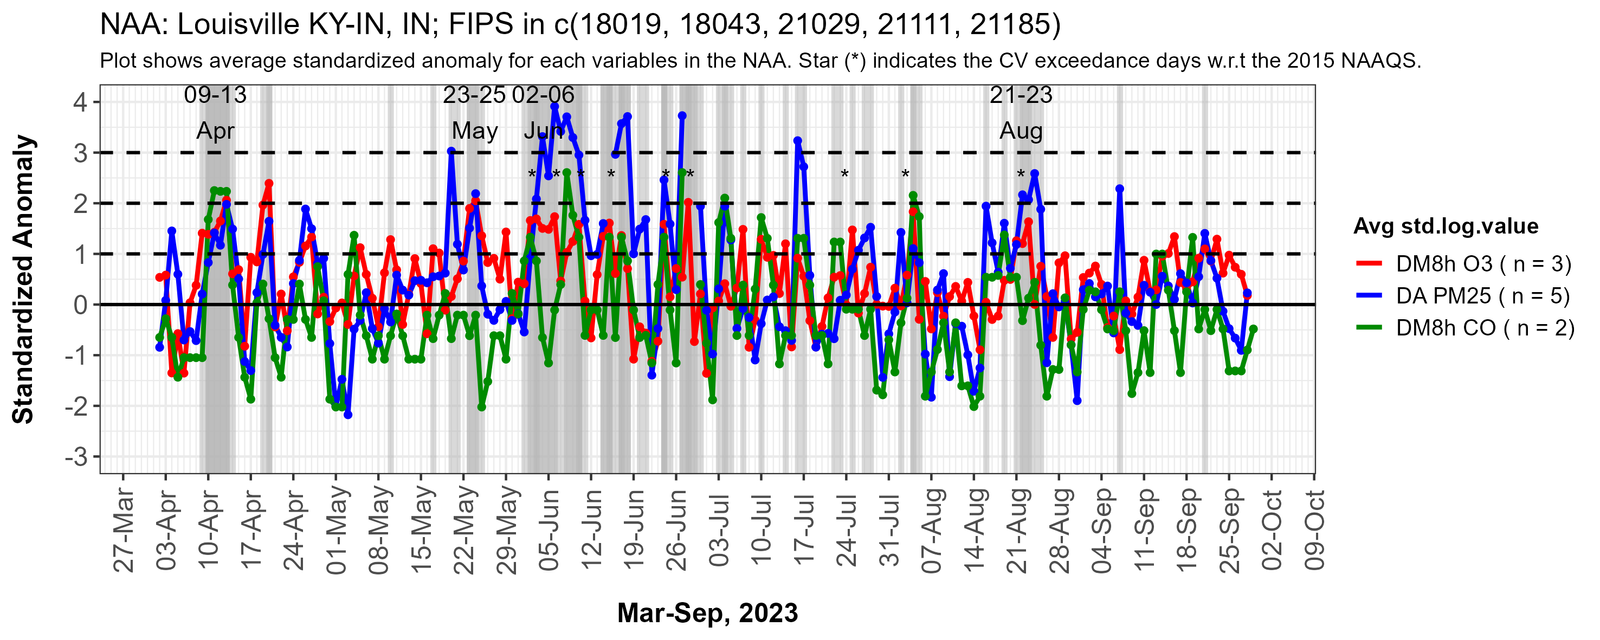
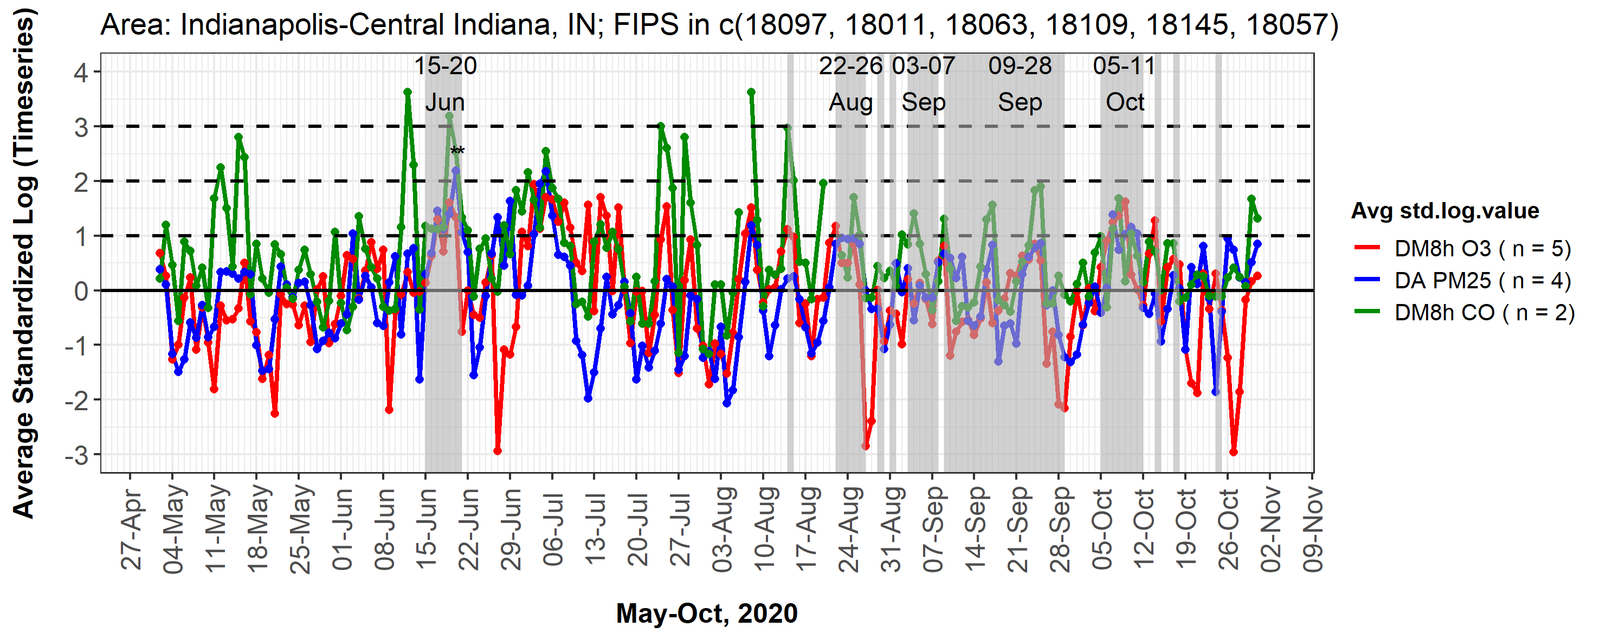
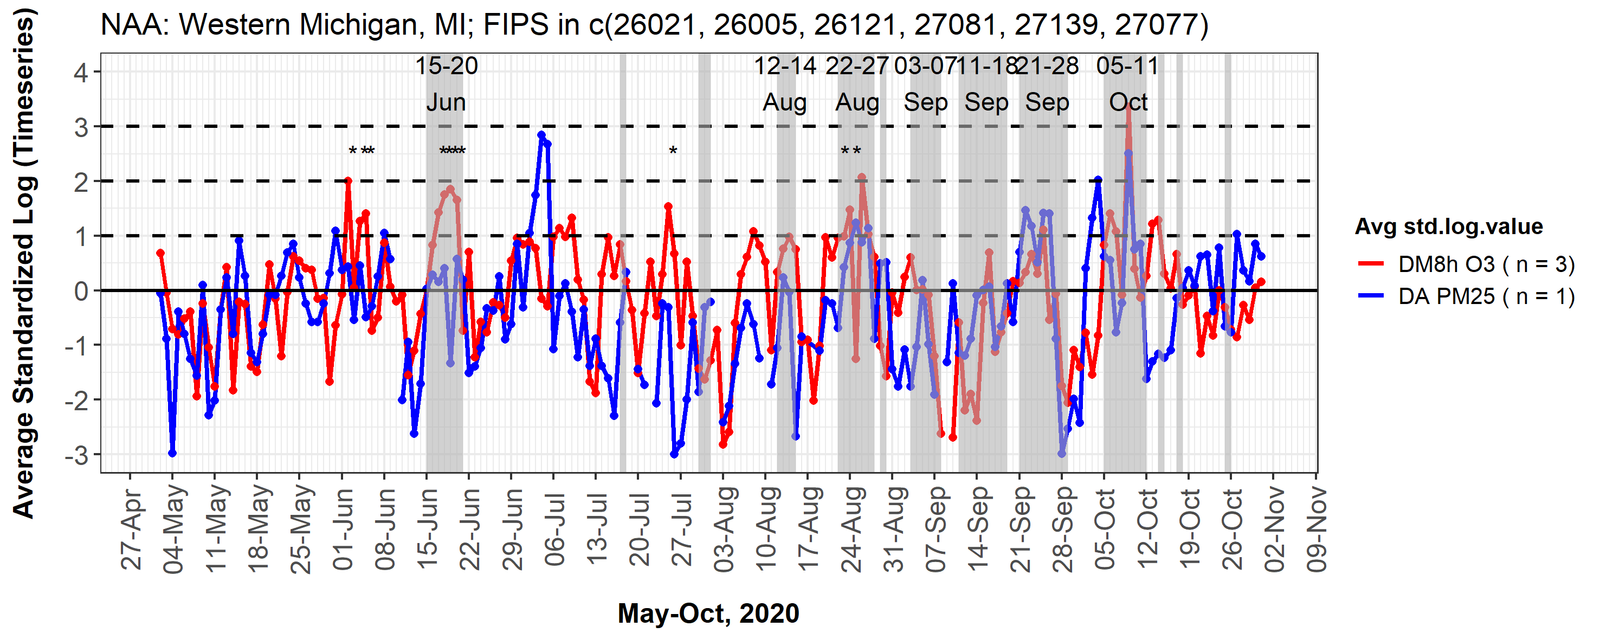
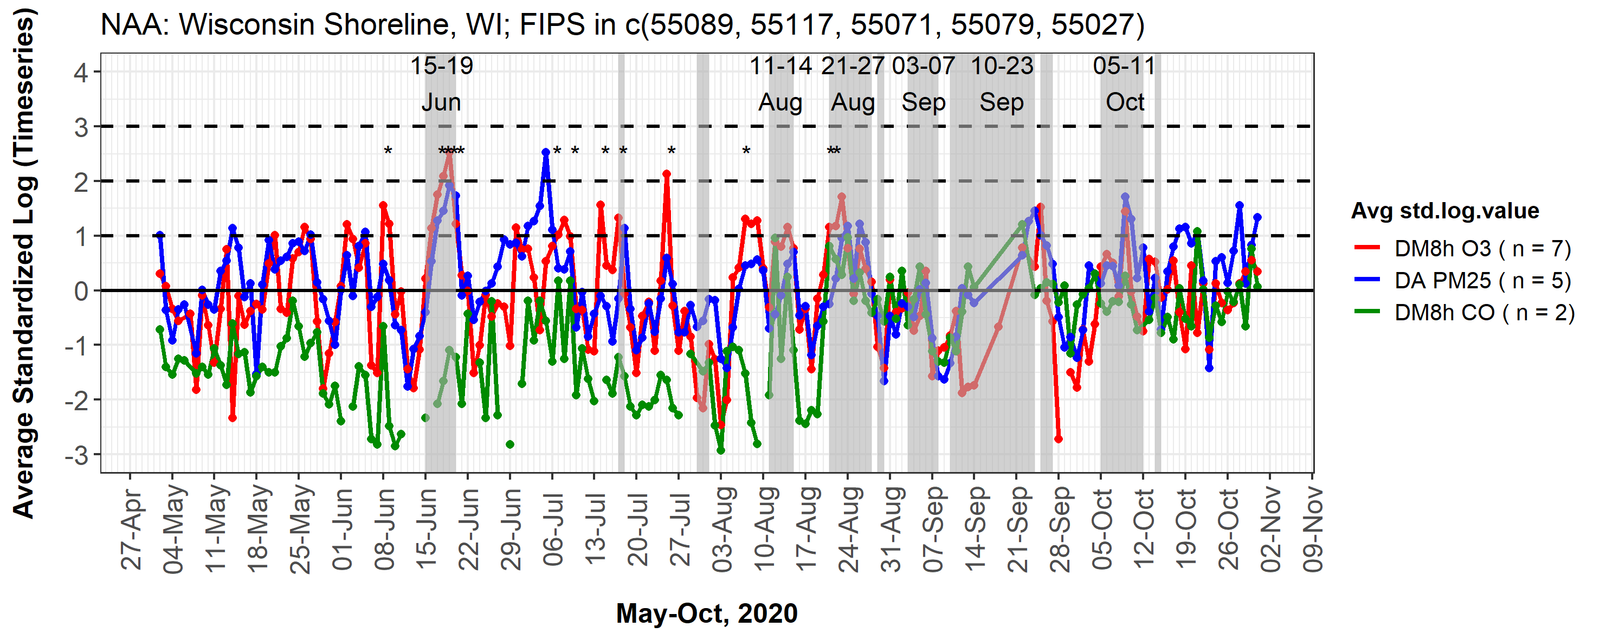
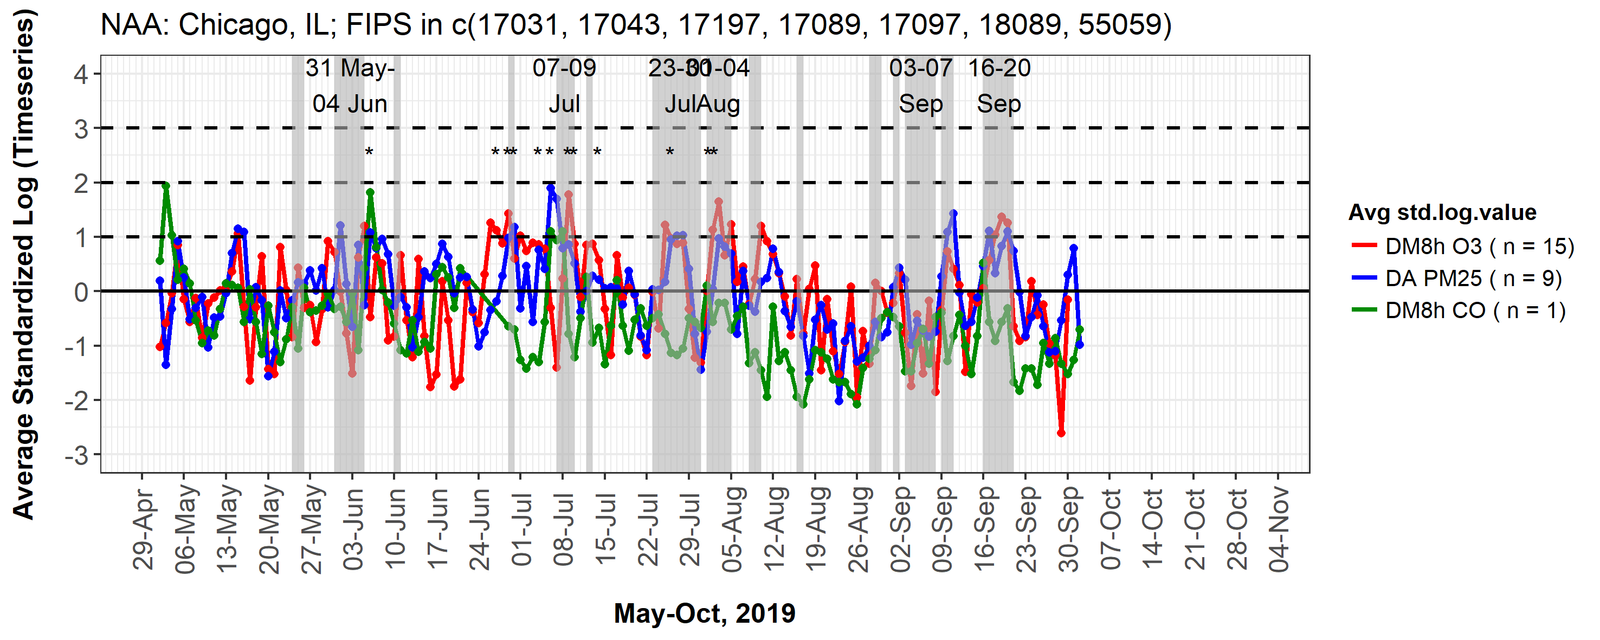
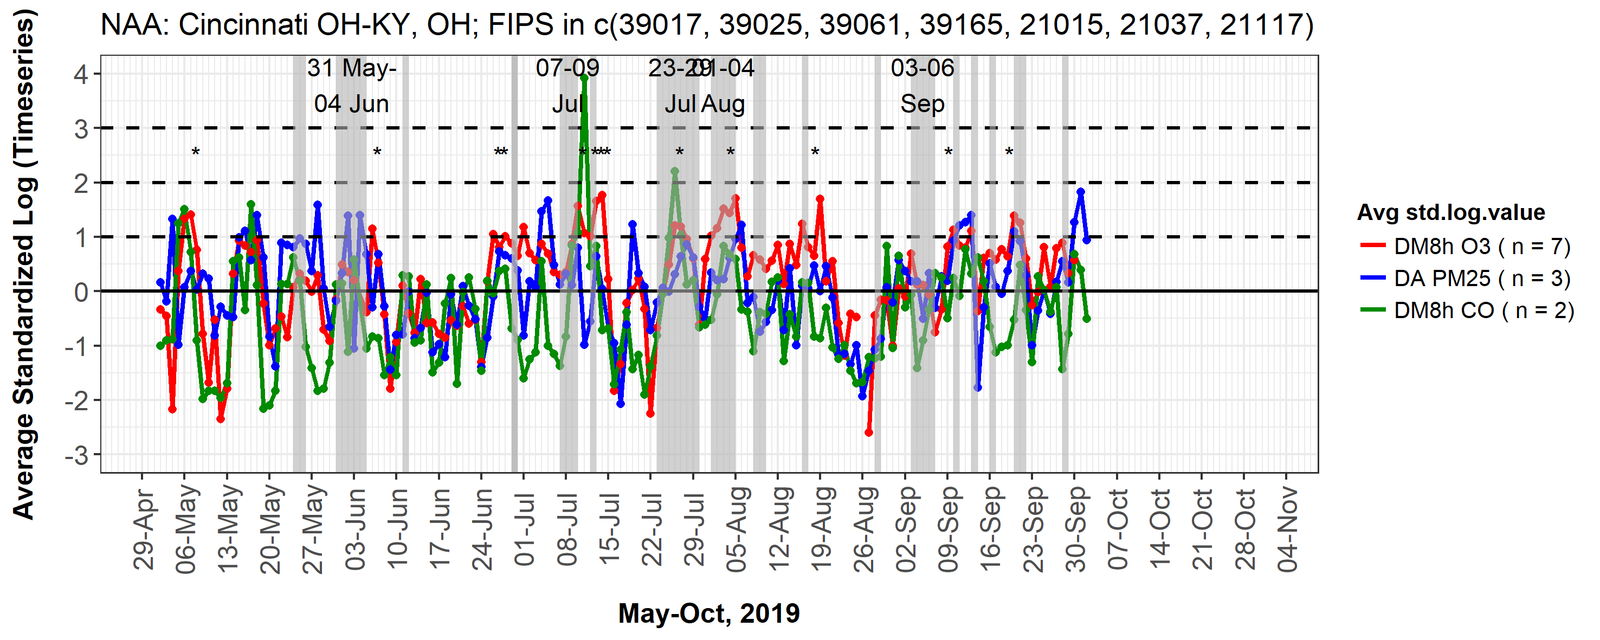
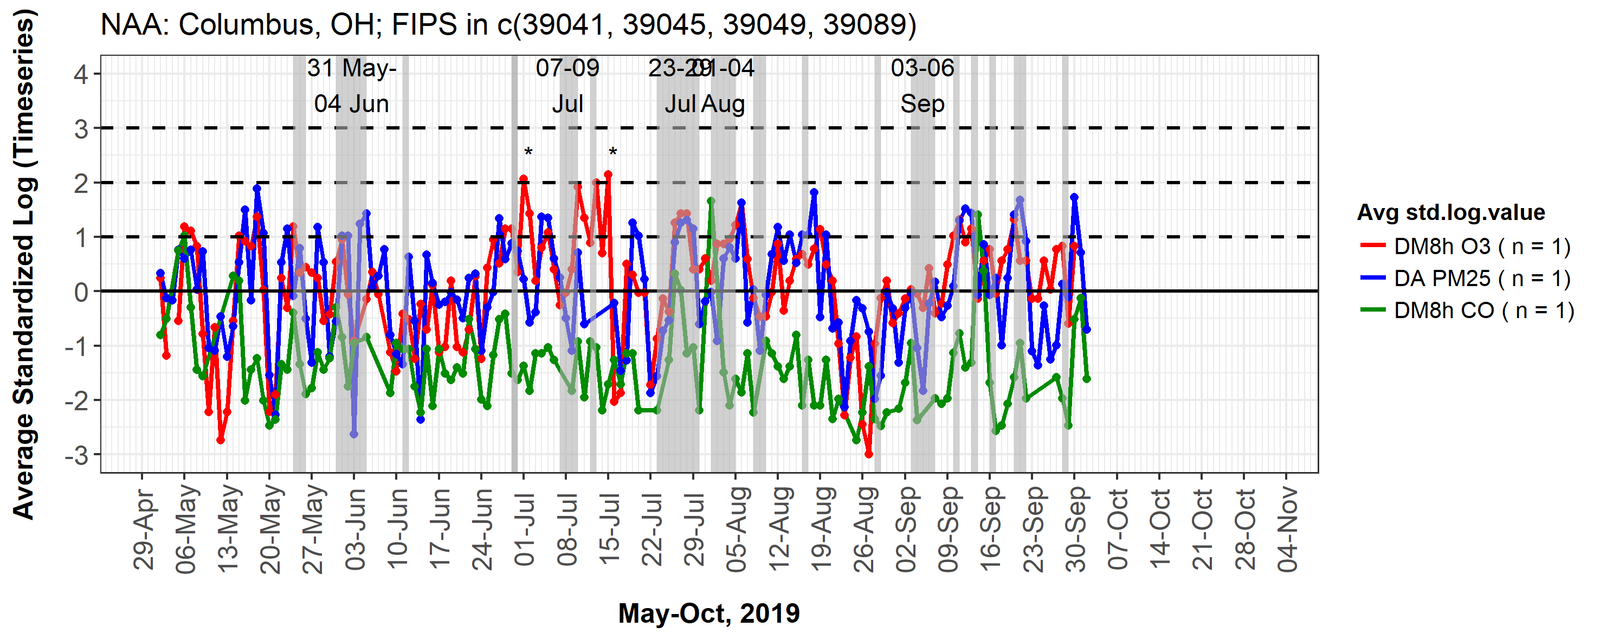
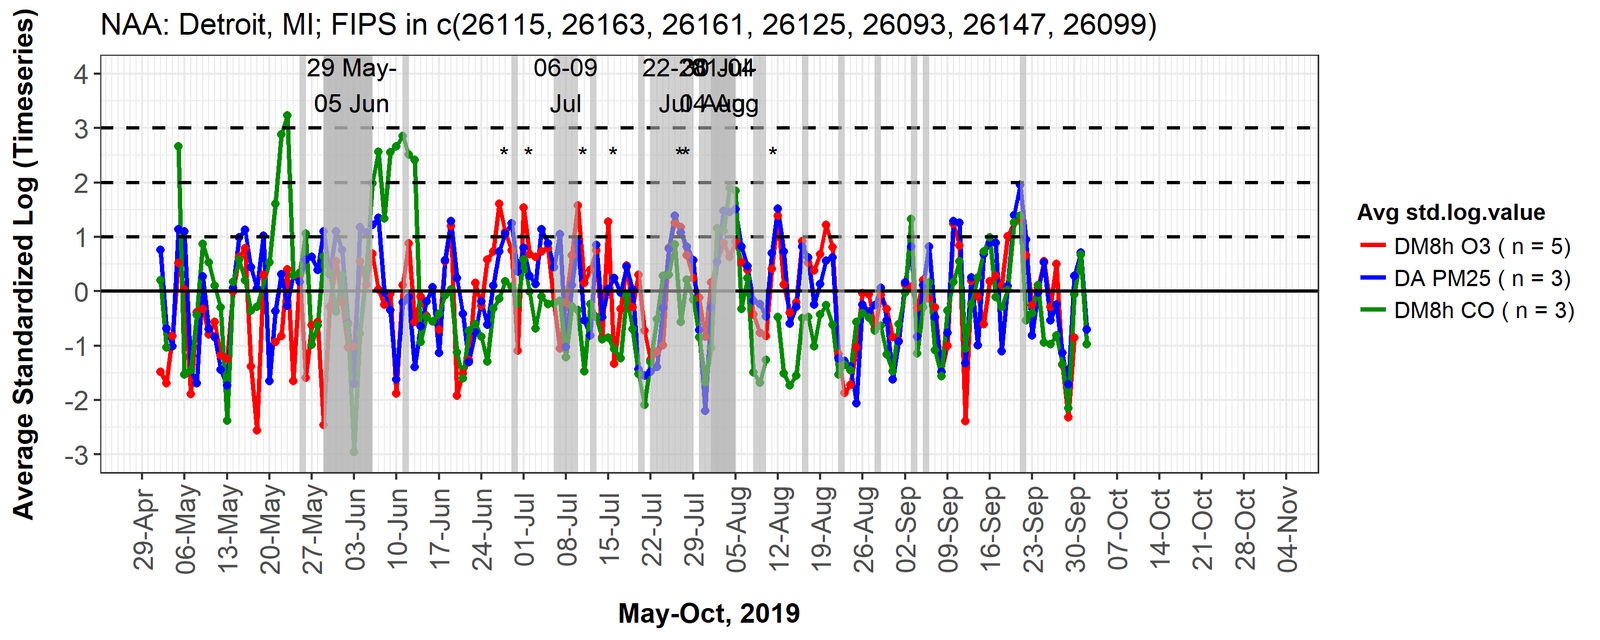
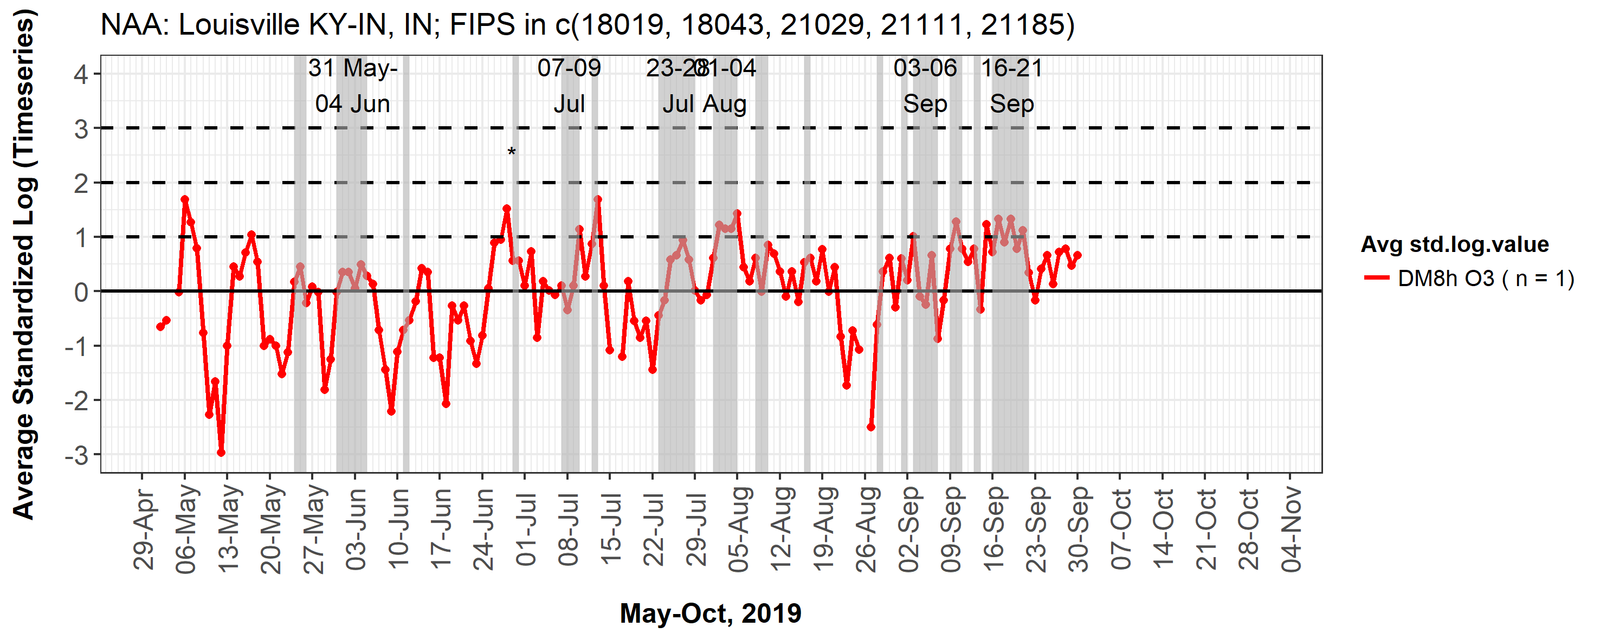
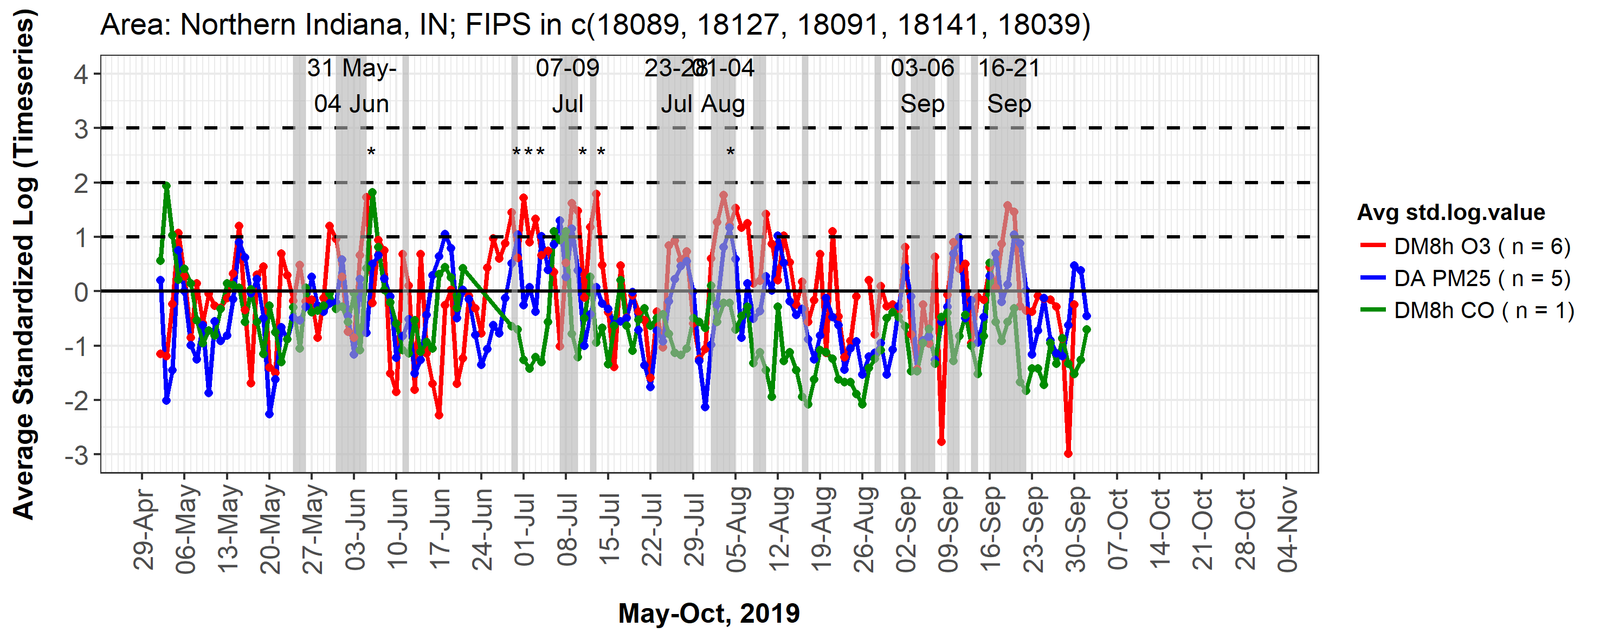
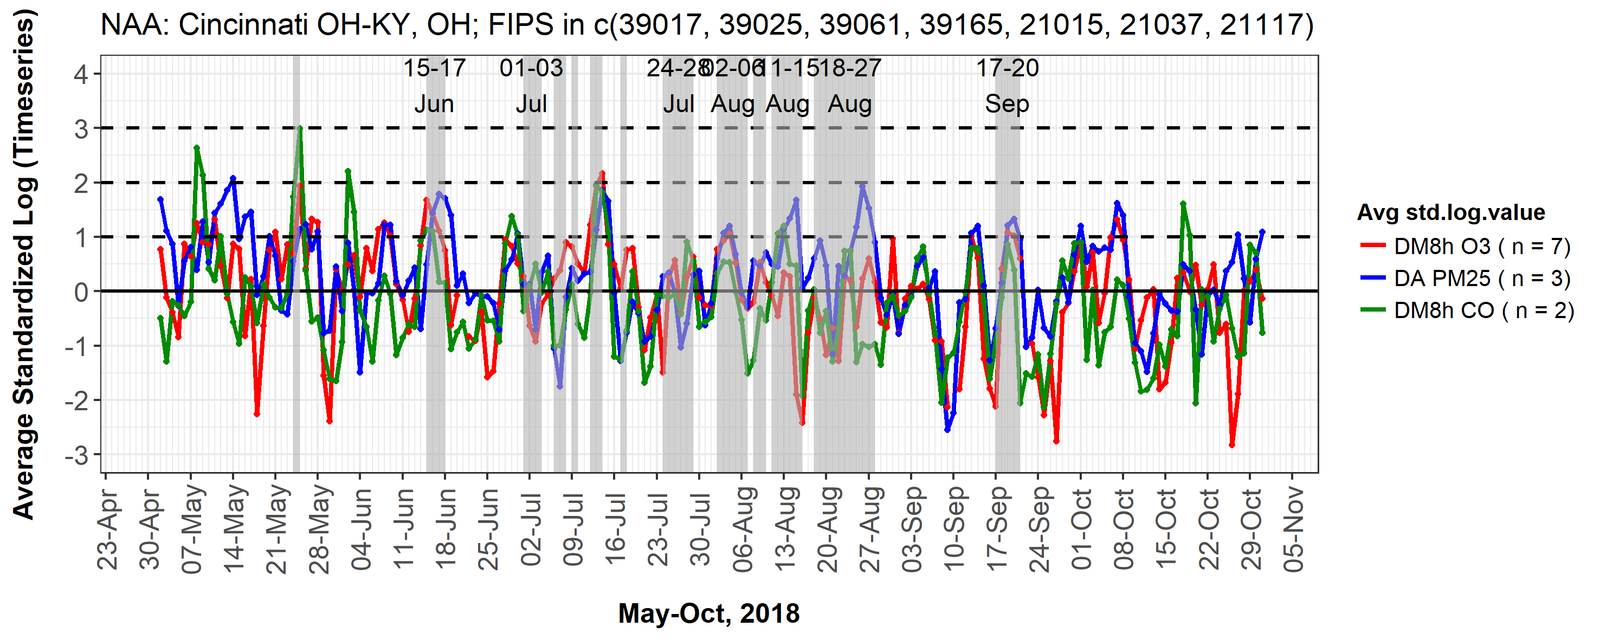
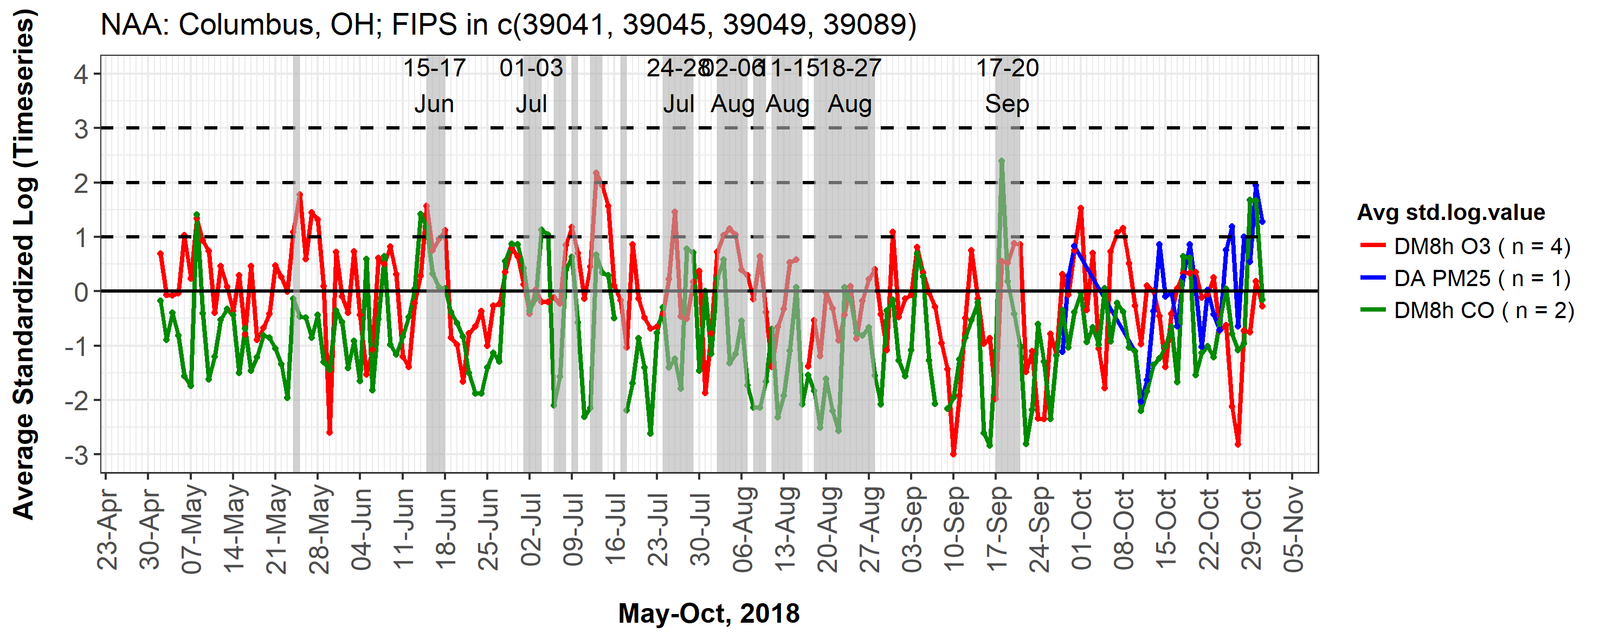
- Average Standardized Log-transformed Timeseries – Plots show O3, CO, and PM2.5 concentration anomalies for the NAA during the 2026 ozone season. These plots summarize the ‘Monitor-specific Standardized Log-transformed Timeseries’ plots below and were created by averaging the standardized timeseries across all monitors within the NAA. Standardization (i.e., normalization) was done using the monthly mean and standard deviation of the log-transformed observed values at each site over the 2020-2025 (excluded 2023) period.
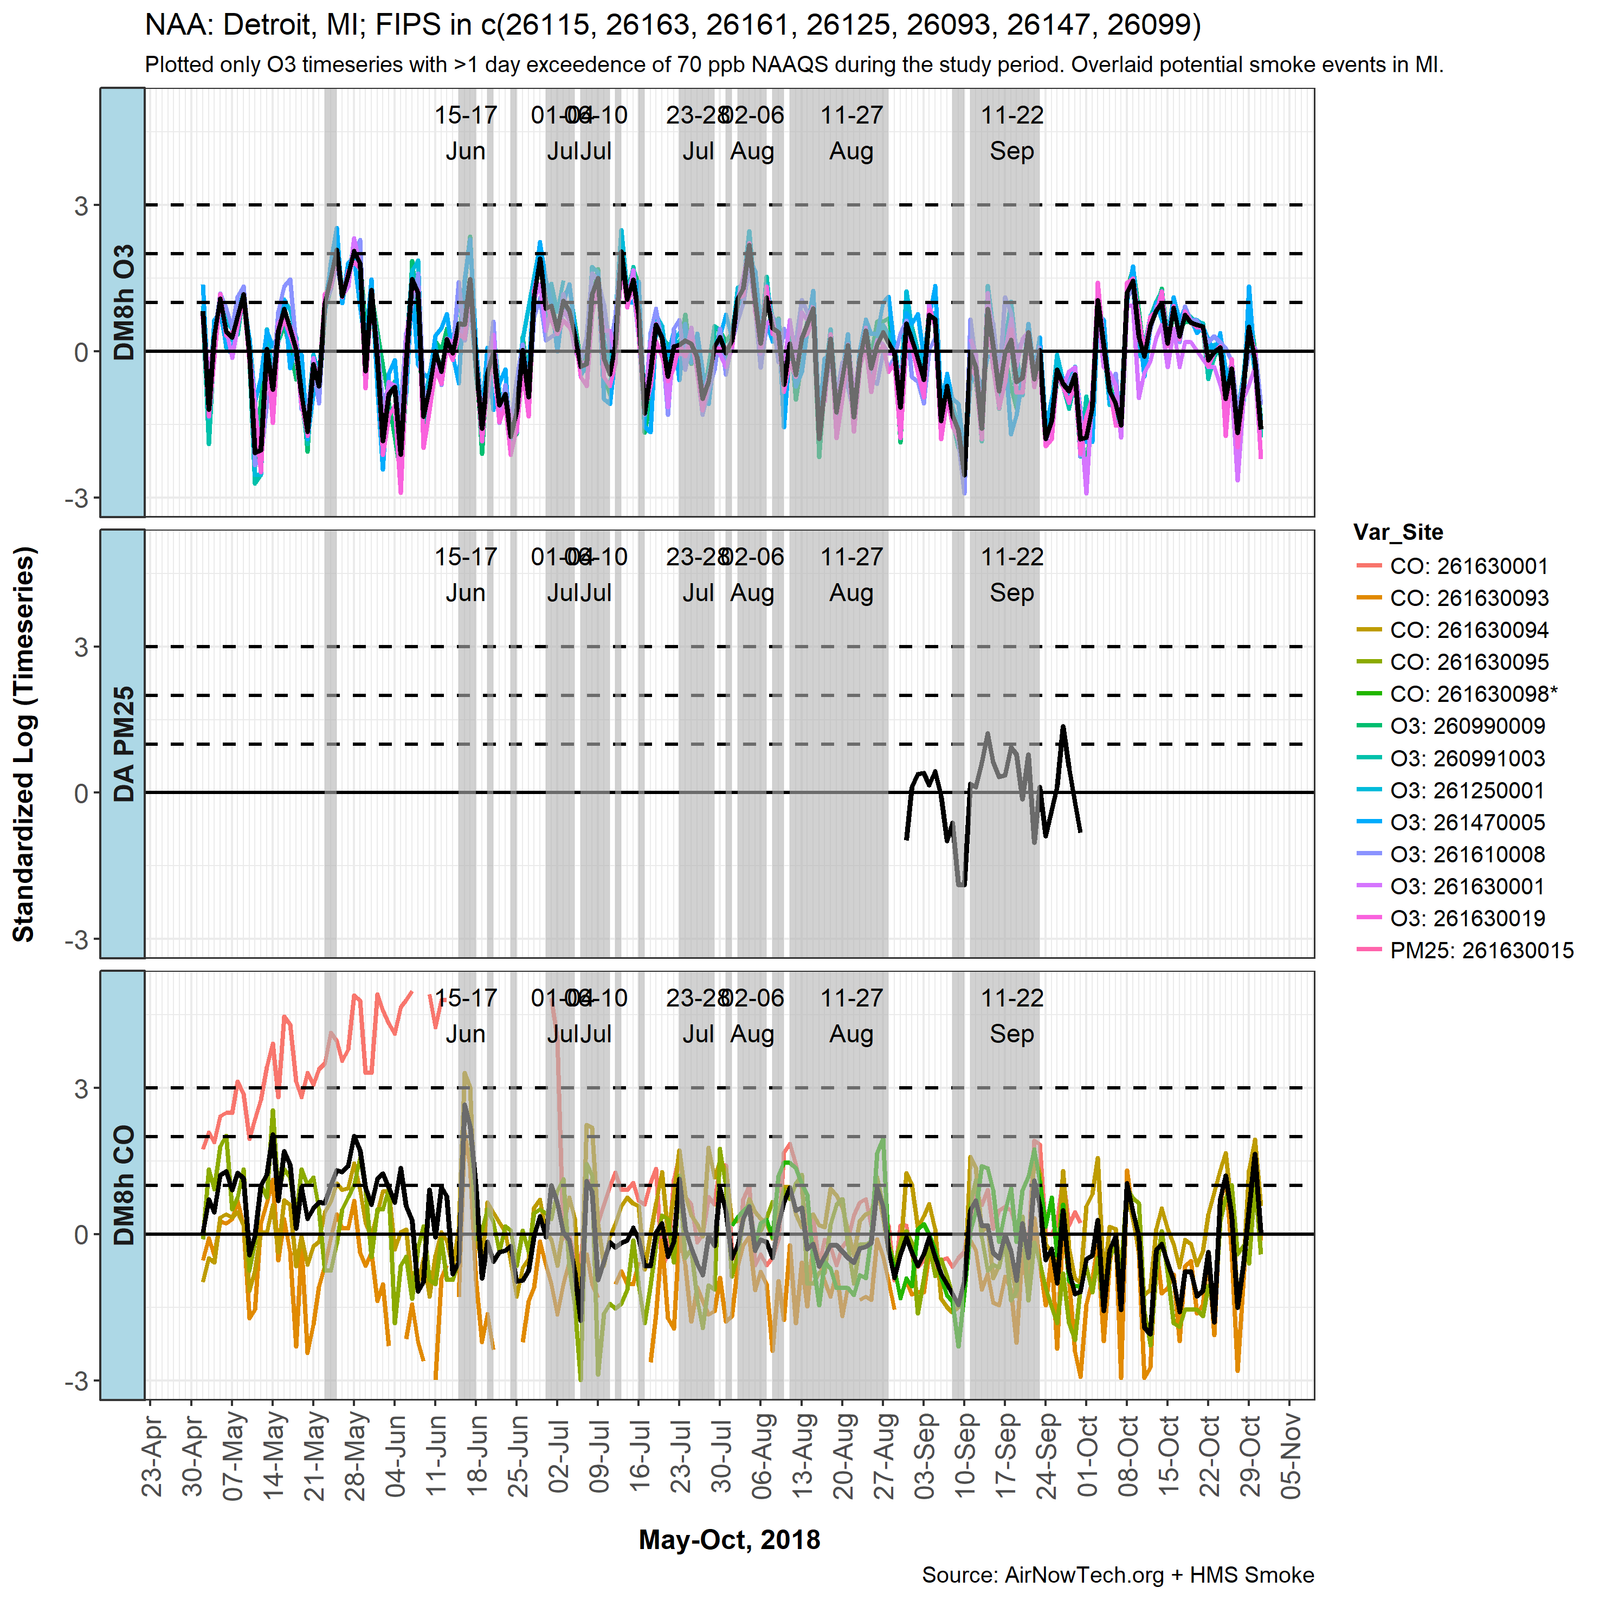
- Monitor-specific Standardized Log-transformed Timeseries – Plots show O3, CO, and PM2.5 concentration anomalies at individual monitors in the NAA during the 2026 ozone season. Standardization (i.e., normalization) was done using the monthly mean and standard deviation of the log-transformed observed values at each site over the 2020-2025 period.
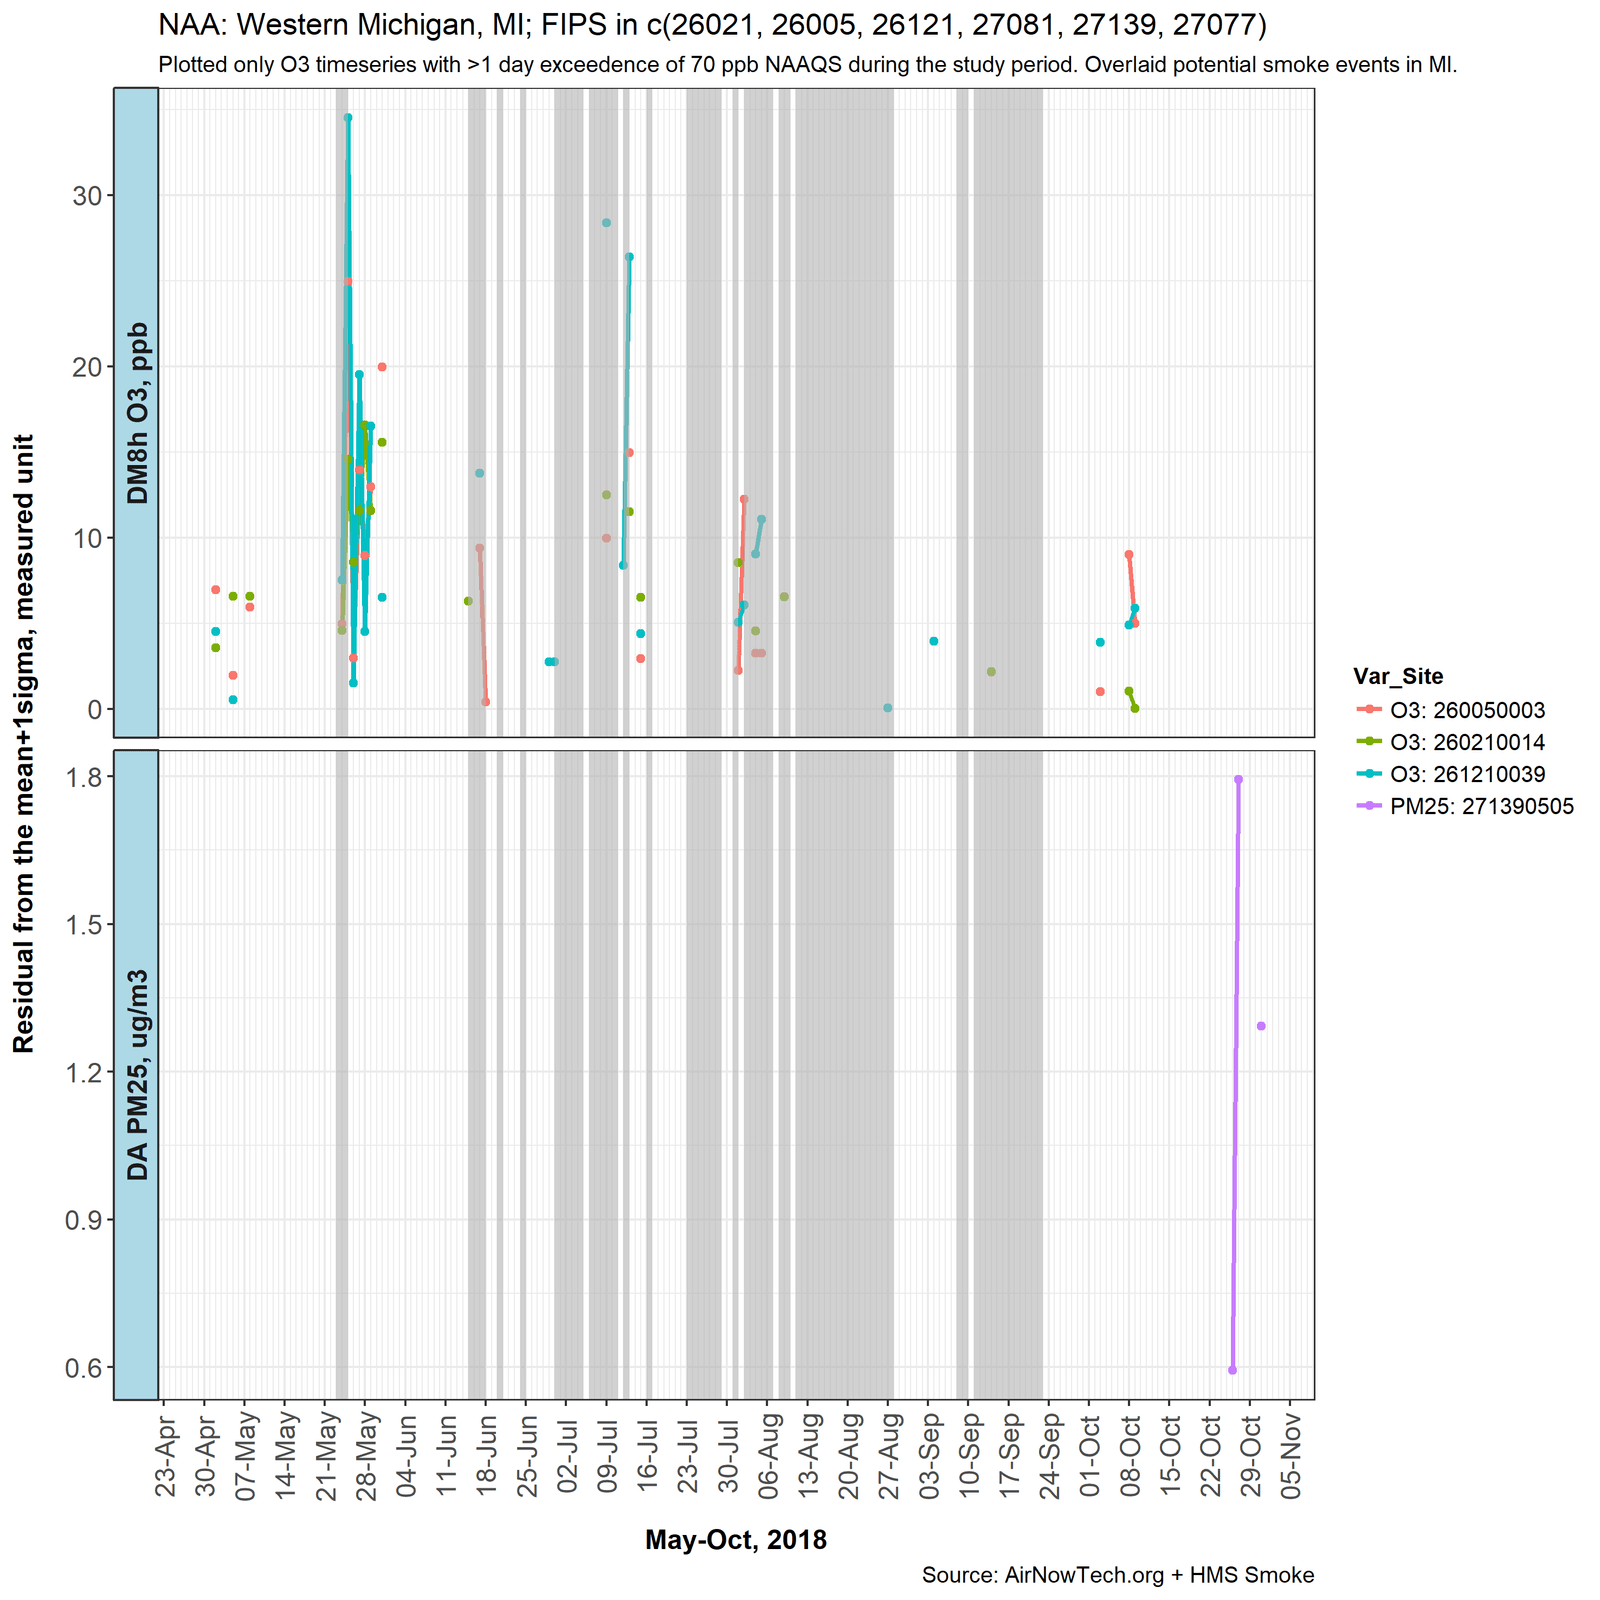
- Concentration Residuals – Plots show O3, CO, and PM2.5 concentrations above the mean +1 standard deviation at individual monitors in the NAA.
All of the plots are overlaid with grey shading to indicate when the HMS smoke product qualitatively shows smoke plumes in the vicinity of the NAA. Click on a plot to expand to a full browser window.
We tested and validated this approach using monitoring and smoke data from 2016. The results for 2016 are shown below. In subsequent sections of this site, we present screening analysis for more recent years.
2016 EE Screening Results
Chicago IL-IN Nonattainment Area


Cleveland OH Nonattainment Area


Wisconsin Shoreline Nonattainment Area


Results
2026 Analysis and Call Notes
Objectives of the 2026 EE workgroup:
- Updated the LADCO O3-PM2.5-CO anomaly metric to use a 5-year rolling average rather than a fixed period average. Specifically, 2026 EE data was normalized by monthly mean and standard deviation recorded in 2020-2025, excluding 2023 period (completed in May 2026).
- Conduct exploratory analysis for PM2.5 EE screening metrics for determining indicator variables and anomaly values for fire smoke influence on PM2.5 concentrations (ongoing)
- Prototype (and possibly deploy) an algorithm for identifying similar meteorological days as to contrast the smoke-influenced days using a Classification & Regression Analysis Tree (CART) and Self-organizing Map (SOM) analyses
2026 EE Screening Results ( as of July 20, 2026)
Twin Cities Area, MN
Wisconsin Shoreline Nonattainment Area
Western MI Nonattainment Area
Chicago IL Nonattainment Area
Indianapolis-Central Indiana
Northern Indiana
Cincinnati OH-KY Nonattainment Area
Columbus OH Nonattainment Area
Cleveland OH Nonattainment Area
Detroit MI Nonattainment Area
Louisville KY-IN Nonattainment Area
St. Louis MO-IL Nonattainment Area
2025 Analysis and Call Notes
Objectives of the 2025 EE workgroup:
- Updated the LADCO O3-PM2.5-CO anomaly metric to use a 5-year rolling average rather than a fixed period average. Specifically, 2025 EE data was normalized by monthly mean and standard deviation recorded in 2019-2022 and 2024 period (completed in May 2025).
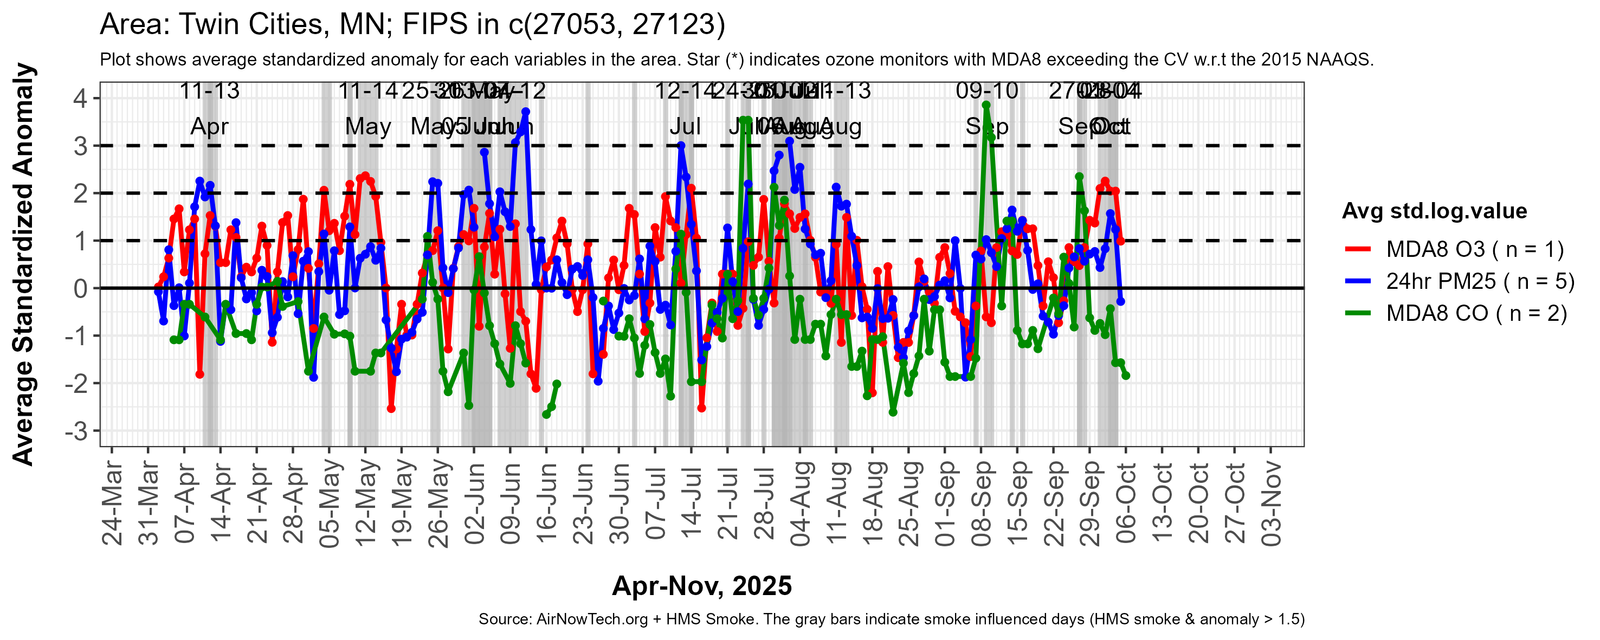
- The Twin Cities, MN was included in the EE screening to indicate wildland fire smoke entering the LADCO region from the northern boundary (completed in July 2025).
- Conduct exploratory analysis for PM2.5 EE screening metrics for determining indicator variables and anomaly values for fire smoke influence on PM2.5 concentrations (ongoing)
- Prototype (and possibly deploy) an algorithm for identifying similar meteorological days as to contrast the smoke-influenced days using a Classification & Regression Analysis Tree (CART) and Self-organizing Map (SOM) analyses
2025 EE Screening Results ( as of Oct 05, 2025)
Twin Cities Area, MN
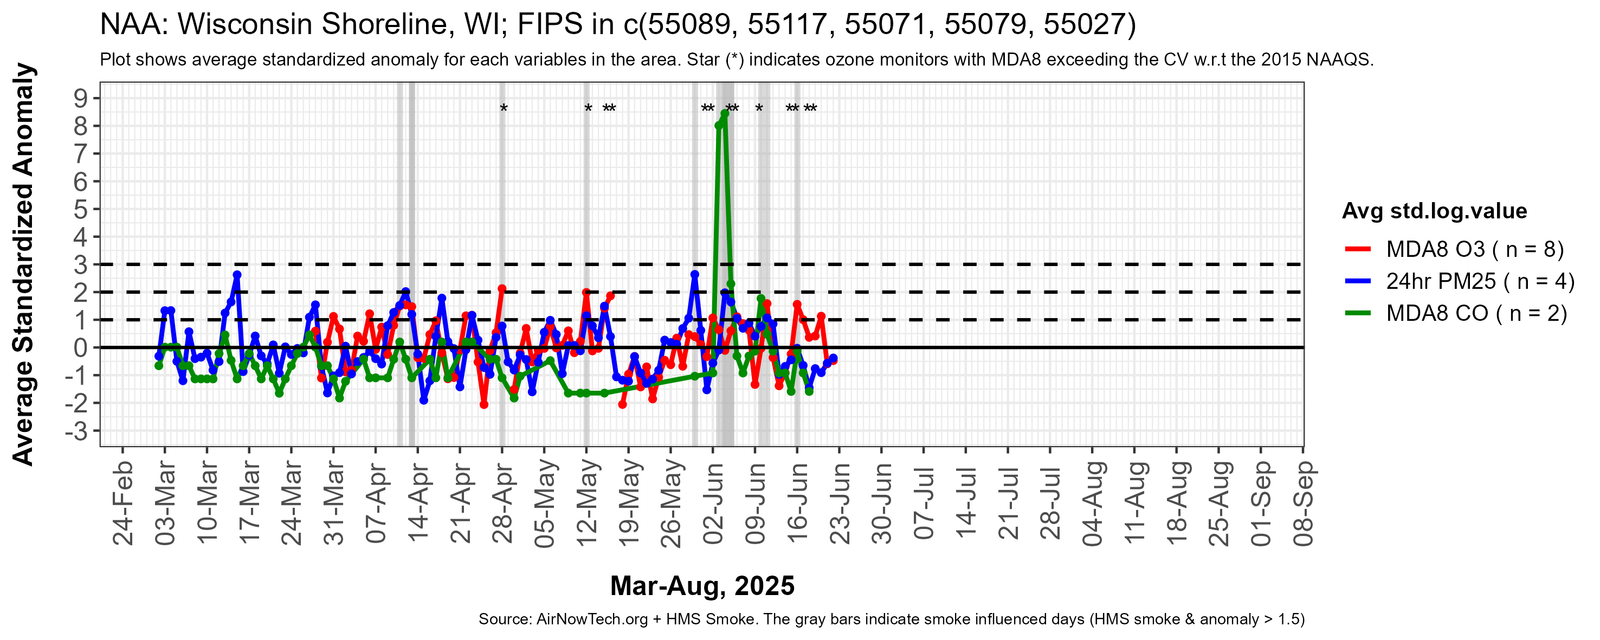
Wisconsin Shoreline Nonattainment Area
Western MI Nonattainment Area
Chicago IL Nonattainment Area
Indianapolis-Central Indiana
Northern Indiana
Cincinnati OH-KY Nonattainment Area
Columbus OH Nonattainment Area
Cleveland OH Nonattainment Area
Detroit MI Nonattainment Area
Louisville KY-IN Nonattainment Area
St. Louis MO-IL Nonattainment Area
2024 Analysis and Call Notes
Objectives of the 2024 EE workgroup:
- Updated the LADCO O3-PM2.5-CO anomaly metric to use a 5-year rolling average rather than a fixed period average. Specifically, 2024 EE data was normalized by monthly mean and standard deviation recorded in 2019-2023 period (completed in May 2024).
- Conduct exploratory analysis for PM2.5 EE screening metrics for determining indicator variables and anomaly values for fire smoke influence on PM2.5 concentrations (ongoing)
- Develop a prototype integrating the 72-hour transport distance and direction at monitors to provide fire source location information for EE screening
- Conduct exploratory analysis for a potential use of visibility data for PM2.5 EE screening
- Prototype (and possibly deploy) an algorithm for identifying similar meteorological days as to contrast the smoke-influenced days using a Classification & Regression Analysis Tree (CART) and Self-organizing Map (SOM) analyses
2024 EE Screening Results ( as of Sep 30, 2024)


Chicago IL Nonattainment Area

Cincinnati OH-KY Nonattainment Area

Cleveland OH Nonattainment Area
Columbus OH Nonattainment Area

Detroit MI Nonattainment Area

Louisville KY-IN Nonattainment Area

Indianapolis-Central Indiana
Northern Indiana

St. Louis MO-IL Nonattainment Area

Western MI Nonattainment Area
Wisconsin Shoreline Nonattainment Area

2023 Analysis and Call Notes
Objectives of the 2023 EE workgroup:
- Updated the LADCO O3-PM2.5-CO anomaly metric to use a 5-year rolling average rather than a fixed period average. Specifically, 2023 EE data was normalized by monthly mean and standard deviation recorded in 2018-2022 period (completed in Apr 2023).
- Automated the process of integrating HMS smoke information and AirNow Tech data into the EE screening (completed in Sep 2023)
- Prototype (and possibly deploy) an integration of meteorological variables and air mass transform direction into the EE screening
- Prototype (and possibly deploy) an identification algorithm for similar meteorological days as to the smoke-influenced screened days using a Classification & Regression Analysis Tree (CART) analysis
- Conduct exploratory analysis for PM2.5 EE screening metric development: tracking daily total PM2.5 against the PM2.5 annual and 24-hour standards; determining indicator variables and anomaly values for identifying the potential smoke influence on PM2.5 concentration
2023 EE Screening Results (data retrieval on Sep 29, 2023)
Chicago IL Nonattainment Area
Cincinnati OH-KY Nonattainment Area

Cleveland OH Nonattainment Area

Columbus OH Nonattainment Area
Detroit MI Nonattainment Area
Louisville KY-IN Nonattainment Area
Indianapolis-Central Indiana

Northern Indiana

St. Louis MO-IL Nonattainment Area

Western MI Nonattainment Area

Wisconsin Shoreline Nonattainment Area

2022 Analysis and Call Notes
Objectives of the 2022 EE workgroup:
- Update the LADCO O3-PM2.5-CO anomaly metric to use a 5-year rolling average rather than a fixed period average. For example, 2021 EE data was normalized by monthly mean and standard deviation recorded in 2017-2021 period.
- Prototype (and possibly deploy) a machine learning algorithm for smoke impact screening
2022 EE Screening Results (as of Sep 29, 2022)
Chicago IL Nonattainment Area

Cincinnati OH-KY Nonattainment Area

Cleveland OH Nonattainment Area

Columbus OH Nonattainment Area

Detroit MI Nonattainment Area

Louisville KY-IN Nonattainment Area

Indianapolis-Central Indiana

Northern Indiana

St. Louis MO-IL Nonattainment Area

Western MI Nonattainment Area

Wisconsin Shoreline Nonattainment Area

2021 Analysis and Call Notes
Objectives of the 2021 EE workgroup:
- Integrate metrics developed during the 2020 Chicago/W Michigan/Cincinnati EE project for identifying smoke impacts into our suite of EE screening products
- Update the LADCO O3-PM2.5-CO anomaly metric to use a 5-year rolling average rather than a fixed period average. For example, 2021 EE data was normalized by monthly mean and standard deviation recorded in 2016-2020 period.
- Prototype (and possibly deploy) a machine learning algorithm for smoke impact screening
- Catalog all data that we’re using for EE screening and that are useful in an EE demonstration and come up with a plan to download and archive ephemeral data during potential smoke events before they’re deleted
- Connect state air quality forecasters in the region with the EE workgroup such that we get notifications when there are smoke events impacting the region
2021 EE Screening Results (as of Oct 27, 2021)
Chicago IL Nonattainment Area

Cincinnati OH-KY Nonattainment Area

Cleveland OH Nonattainment Area

Columbus OH Nonattainment Area

Detroit MI Nonattainment Area

Louisville KY-IN Nonattainment Area

Indianapolis-Central Indiana

Northern Indiana

St. Louis MO-IL Nonattainment Area

Western MI Nonattainment Area

Wisconsin Shoreline Nonattainment Area

2021 Call Notes
Action Items
- …
Call Agenda
- Roll
- August Action Item Review
- LADCO PM2.5 trends analysis
- August air quality data review (LADCO design value tracker)
Call Notes
August Action Item Review
- LADCO: generate PM2.5 trends plots for monitors in the region; status: done
August air quality data review
- HMS showed that smoke was present in the column over the region for most of the month of August
- High ozone periods in August: August 4 (Chicago), August 5 (WI Lakeshore), August 6 (Sarnia), August 7 (IL/WI border), August 18 (Door County, WI), August 21 (Sarnia, MI), August 23 (Western Lake MI shoreline), August 24 (Detroit, Cleveland, Cincinatti), August 25-27 (Chicago/Lake MI)
- High 24-hour PM2.5 in August: August 1 (S. IL and IN), August 2-6 (N. MN and WI), August 25-26 (N. MN)
PM2.5 Trends
Action Items
- LADCO: Create PM2.5 trends charts
Call Agenda
- Roll
- July Action Item Review
- July air quality data review (LADCO design value tracker)
- CART analysis for EE applications
- EPA decision on Chicago NAA demonstration
Call Notes
July Action Item Review
- States: Identify potential annual PM2.5 NAAQS issues for each state if the standard is lowered below 12 ug/m3; status: will discuss on call today
- IDEM and LADCO: prepare for next call CART EE analysis update from IDEM and LADCO; status: will discuss on call today
July air quality data review
- Smoke was present (according to HMS) over most of the region through almost the entire month of July
- High ozone periods in July: July 6 (W MI), July 20 (Chicago/NW Indiana), July 22-23 (W. Lake MI, Cincinnati, St. Louis), July 26-28 (across the LADCO region)
- High 24-hour PM2.5 in July: July 4-5 (urban areas and eastern OH), July 14-17 (N. MN), July 20 (MN and Eastern OH), July 21 (N. MN, Central IL and IN), July 29-31 (MN and WI)
CART analysis for EE applications
EPA decision on Chicago NAA demonstration
- EPA Non-Concurrence Letter to IL EPA
- EPA TSD supporting the IL EPA letter
- Table 6 on page 32, criteria that agency provide prompt notification of event; forecast didn’t identify potential of smoke forecasts for the fire event; need to meet notification requirements (see the note in the TSD).
PM2.5 monitoring status in each state
- MI: has three monitors in Detroit with DVs above 10
- IN: has DVs in the Indy area above 11 (11.9, 11.2, 10.4), East Chicago is 10.9 (Central and NW Indiana); 18th St and I-70 monitor are on the way up from 2016-18 DV, and now it’s on the way up
- MN: would be clear if it went to 10, have some monitors around 8 ug/m3; WHO standard for PM2.5 is 10
- OH: could have issues in the Cinci, Cleveland, and Dayton
- IL: all DVs are below 11, highest is 10.8 at a near road site; Schiller park is at 10.6
- LADCO do analysis of PM2.5 trends for next call
Ideas for next call
- Potential PM2.5 NAAQS issues for each state
- CART EE analysis update from IDEM and LADCO
Action Items
- States: Identify potential annual PM2.5 NAAQS issues for each state
- IDEM and LADCO: prepare for next call CART EE analysis update from IDEM and LADCO
Call Agenda
- Roll
- June Action Item Review
- Update on outstanding OH, MI, and IL EE demos
- June air quality data review, including LADCO screening results and LADCO design value tracker
Call Notes
June Action Item Review
- States: review LADCO EE charter scope; status: updates received from some states, charter sent to TOC for review
- Zac: post LADCO ozone DV tracker to the EE webpage; status: done
- Zac: send charter to TOC and air directors; status: done
- Angie: update ozone DV tracking sheet with 2019 and 2020 data; status: in progress
- Tsengel: post May EE tracking metric results to the LADCO EE website; status: done
Update on outstanding OH, MI, and IL EE demos
- No updates from any of the states
- EPA – EPA is finishing up review of the IL materials and will reach out to IL EPA shortly; OH is next in line
June data review
- 2021 Dates w/ MDA8 O3 > 70 ppb and smoke overhead
- April 3-5 – Region-wide
- May 1 – Lake MI, central IL and IN
- May 24 – Louisville
- May 25 – Cinci and Columbus
- May 25 – Cinci and Columbus
- June 2-4 – Lake MI region (IL and MI); smoke on June 1-2 but it cleared out by the 3rd
- June 4 – Louisville and Cincinnati
- June 8 and 10 – Minneapolis
- June 11 – Western Lake Michigan
- June 12 – Indy and Detroit
- June 14 – Cincinnati, St. Louis and southern IN and IL
- June 16-17 – St. Louis
- June 18 – Southern Lake MI and Indy
- July 6 – Western MI
- Discussion of PM2.5 values around July 4 and state perspectives on whether and where they may have PM2.5 attainment issues if the standard is lowered; the 2020 Policy Assessment by EPA concluded that the scientific evidence and information support revising the level of the annual standard for the PM NAAQS to below the current level of 12 micrograms per cubic meter while retaining the 24-hour standard.
- Potential PM2.5 NAAQS issues for each state
- CART EE analysis update from IDEM and LADCO
Ideas for next call
Action Items
- States: review LADCO EE charter scope
- Zac: send charter to TOC and air directors
- Angie: update DV tracking sheet with 2019 and 2020 data
- Tsengel: post May tracking metric results to this site
Call Agenda
- Roll
- May Action Item Review
- Update on outstanding OH, MI, and IL EE demos
- LADCO design value tracker
- May air quality data review
Call Notes
May Action Item Review
- Draft WG charter is ready to go to the TOC
- Zac seeking one last review by the end of the day today
- Are there any scope items that we should be considering this year: e.g., looking at alternative monitoring assets in NAAs for supporting EE demonstrations?
Update on outstanding OH, MI, and IL EE demos
- OH – no updates
- MI – not yet submitted to EPA
- IL – supplemental information sent to EPA in May
- EPA – EPA is looking at IL materials with headquarters, and coordinating review of OH’s submittal
LADCO Design Value Tracker
- LADCO developed a tracking sheet for ozone DVs by NAA
- Monthly updates. Can these be more frequent? Yes, but states will need to tell LADCO when to update
- Can LADCO go back and include data from 2019 and 2020? Yes
- Can we include smoke information in the sheet? LADCO will look into including the LADCO screening metric, and possible “EE Score” into the DV tracker
- NC DENR developed a web-service map in-house (2-3 months of development) that automatically pulls data everyday; LADCO has ambitions to create this DV tracker as a web service
May air quality data review
- 2021 Dates
- April 3-5 – Region-wide
- May 1 – Lake MI, central IL and IN
- May 24 – Louisville
- May 25 – Cinci and Columbus
- IN looking at back trajectories for May 24, pointing to smoke sources in the southeast
- HMS smoke text product
Action Items
- LADCO: Finalize workgroup charter by next call
Call Agenda
- Roll
- April Action Item Review
- Update on outstanding OH, MI, and IL EE demos
- EE workgroup workplan proposal for the TOC and air directors
- Air quality data review to date
Call Notes
April Action Item Review
- Mat Hollinger: Review recent EE demonstrations and create a draft catalog of datasets used for the weight of evidence
- LADCO: Create screening metric analysis for April 2021 data
- Zac: Send NASA information to the group for projects working on applying satellite data for EE demos
- All: Review the Exceptional Events Workgroup Charter and comment/update
Update on outstanding OH, MI, and IL EE demos
- OH – submitted to US EPA on April 13 (link to demo)
- MI – submitted draft to US EPA on March 24; public comment end April 20; haven’t yet submitted official demo to EPA, working on responding to public comments (link to demo)
- IL – public notice period ended January 27 (link to demo); posted December 21 to the IL EPA public notice page); submitted to US EPA February 1
EE workgroup workplan proposal for the TOC and air directors
- Update LADCO screening metrics with rolling 5-year average data and indicators developed during the latest round of EE demo work
- Develop a catalog of EE demo weight of evidence data
- Develop a concept and prototype real-time EE analysis
- Connect the EE workgroup and forecast groups
- Prototype a machine learning application for EE demonstration use
- Understand the EE review process and debrief on the recent demonstrations with EPA R5
- Regional EE demonstration discussion
- Review the process of the recent demonstrations; each demo was sufficiently unique, particularly with the dates covered, that a regional demo would have been difficult
- Could there have a been single document that showed the overall story in the region and then individual analyses?
- Each state could have submitted the regional document, that could that have required less tailoring than the approach we used for the recent demos; could there have been efficiencies in using one big regional analysis
Air quality data review to date
- Looked at the early April smoke event in the region; noted higher than normal O3, PM2.5, and CO concentrations across the region for that period
- The LADCO EE indicators identified this early April period as a smoke enhancement, but ozone levels were too low to be regulatory significant
Action Items
- Mat Hollinger: Review recent EE demonstrations and create a draft catalog of datasets used for the weight of evidence
- LADCO: Create screening metric analysis for April 2021 data
- Zac: Send NASA information to the group for projects working on applying satellite data for EE demos
- All: Review the Exceptional Events Workgroup Charter and comment/update
Call Agenda
- Roll
- Brief review of past workgroup activities and accomplishments (2018-2020)
- Workgroup goals for the 2021 ozone season
- Workgroup charter – draft charter developed from the O3 Technical WG, seeking comments on this charter
Call Notes
Roll
- MN, WI, IN, MI, OH, IL, EPA R5, LADCO
Review of past workgroup activities and accomplishments (2018-2020)
2018
- Initiated the workgroup
- Created a webpage with resources/links at www.ladco.org
- Decided on using the workgroup as a triage analysis of smoke impacts on ozone
- Developed and refined the PM2.5/CO/O3 anomaly screening
2019
2020
Workgroup goals for the 2021 ozone season
Thoughts from the states
- MN (Fawkes): participation has been to listen in on what others are doing; don’t have ozone issues but just trying to learn and listen
- WI (Alex): interested to hear what others have to say about looking into more real time analysis; picked-up wildfire smoke last weekend in the surface monitors, was 2 ppb from an ozone violation, exceptional for early April; how to stay on top of and document events in real time?
- IN (Several): interested to hear EPAs feedback from the previous demonstrations; are there areas that we can target from that feedback? To help refine this activities in this workgroup; forecasting group is on this call, same group that are on the weekly AQ forecast calls; switched to doing a google doc forecast and type in their forecasts; will start it up in the beginning of May
- Question: can LADCO’s screening metric be made to work in real-time?
- NASA HAQAST is looking to form a TIGER team to bring in real-time analysis with satellite data
- What data are ephemeral that need to be downloaded before they go away? Start by cataloging the EE demonstration data and look at if any of those could be added to our screening process; add these to the triage process, and identify data to download
LADCO’s Ideas
- Integrate metrics developed during the Chicago/W Michigan/Cincinnati EE project for identifying smoke impacts into our suite of EE screening products; Tsengel added some indicators to the EE screening metric over the last year and she wants to make these part of the operational indicators that we look at each month
- Scoring combines high ozone, presence of smoke, and anomalies in O3, CO, and PM concentrations; higher scores indicated more EE potential
- Site specific information will be distributed to the group
- Create an automatic data pull to make this work in real-time
- Update the LADCO O3-PM2.5-CO anomaly metric to use a 5-year rolling average rather than a fixed period average; up to now we’ve been normalizing the observations using 2014-2018 monthly averages; we will update this approach to use averages from the previous 5 years…which for 2021 will be 2016-2020.
- Prototype (and possibly deploy) a machine learning algorithm for smoke impact screening; apply CART to the June 2020 smoke event period to identify smoke impacts on surface ozone; extend this approach to the 2021 ozone season
- List all data that we’re using for EE screening and that are useful in an EE demonstration and come up with a plan to download and archive ephemeral data during potential smoke events before they’re deleted; air quality model forecasts (like from NOAA) are one data product that I have in mind; are there others?
- Connect state air quality forecasters in the region with the EE workgroup such that we get notifications when there are smoke events impacting the region
Workgroup charter
- Draft charter developed from the O3 Technical WG, seeking comments on this charter
- Link to charter
2020 Analysis and Call Notes
Objectives of the 2020 EE workgroup:
- Identify potential EEs for ozone and PM2.5 in 2020
- Review the 2018-19 records and find potential for regulatory significant EE events
- Learn how to integrate other data, including satellite data into EE screening
- Build a conceptual model for a regional EE demo
2020 EE Screening Results (as of Nov 20, 2020)
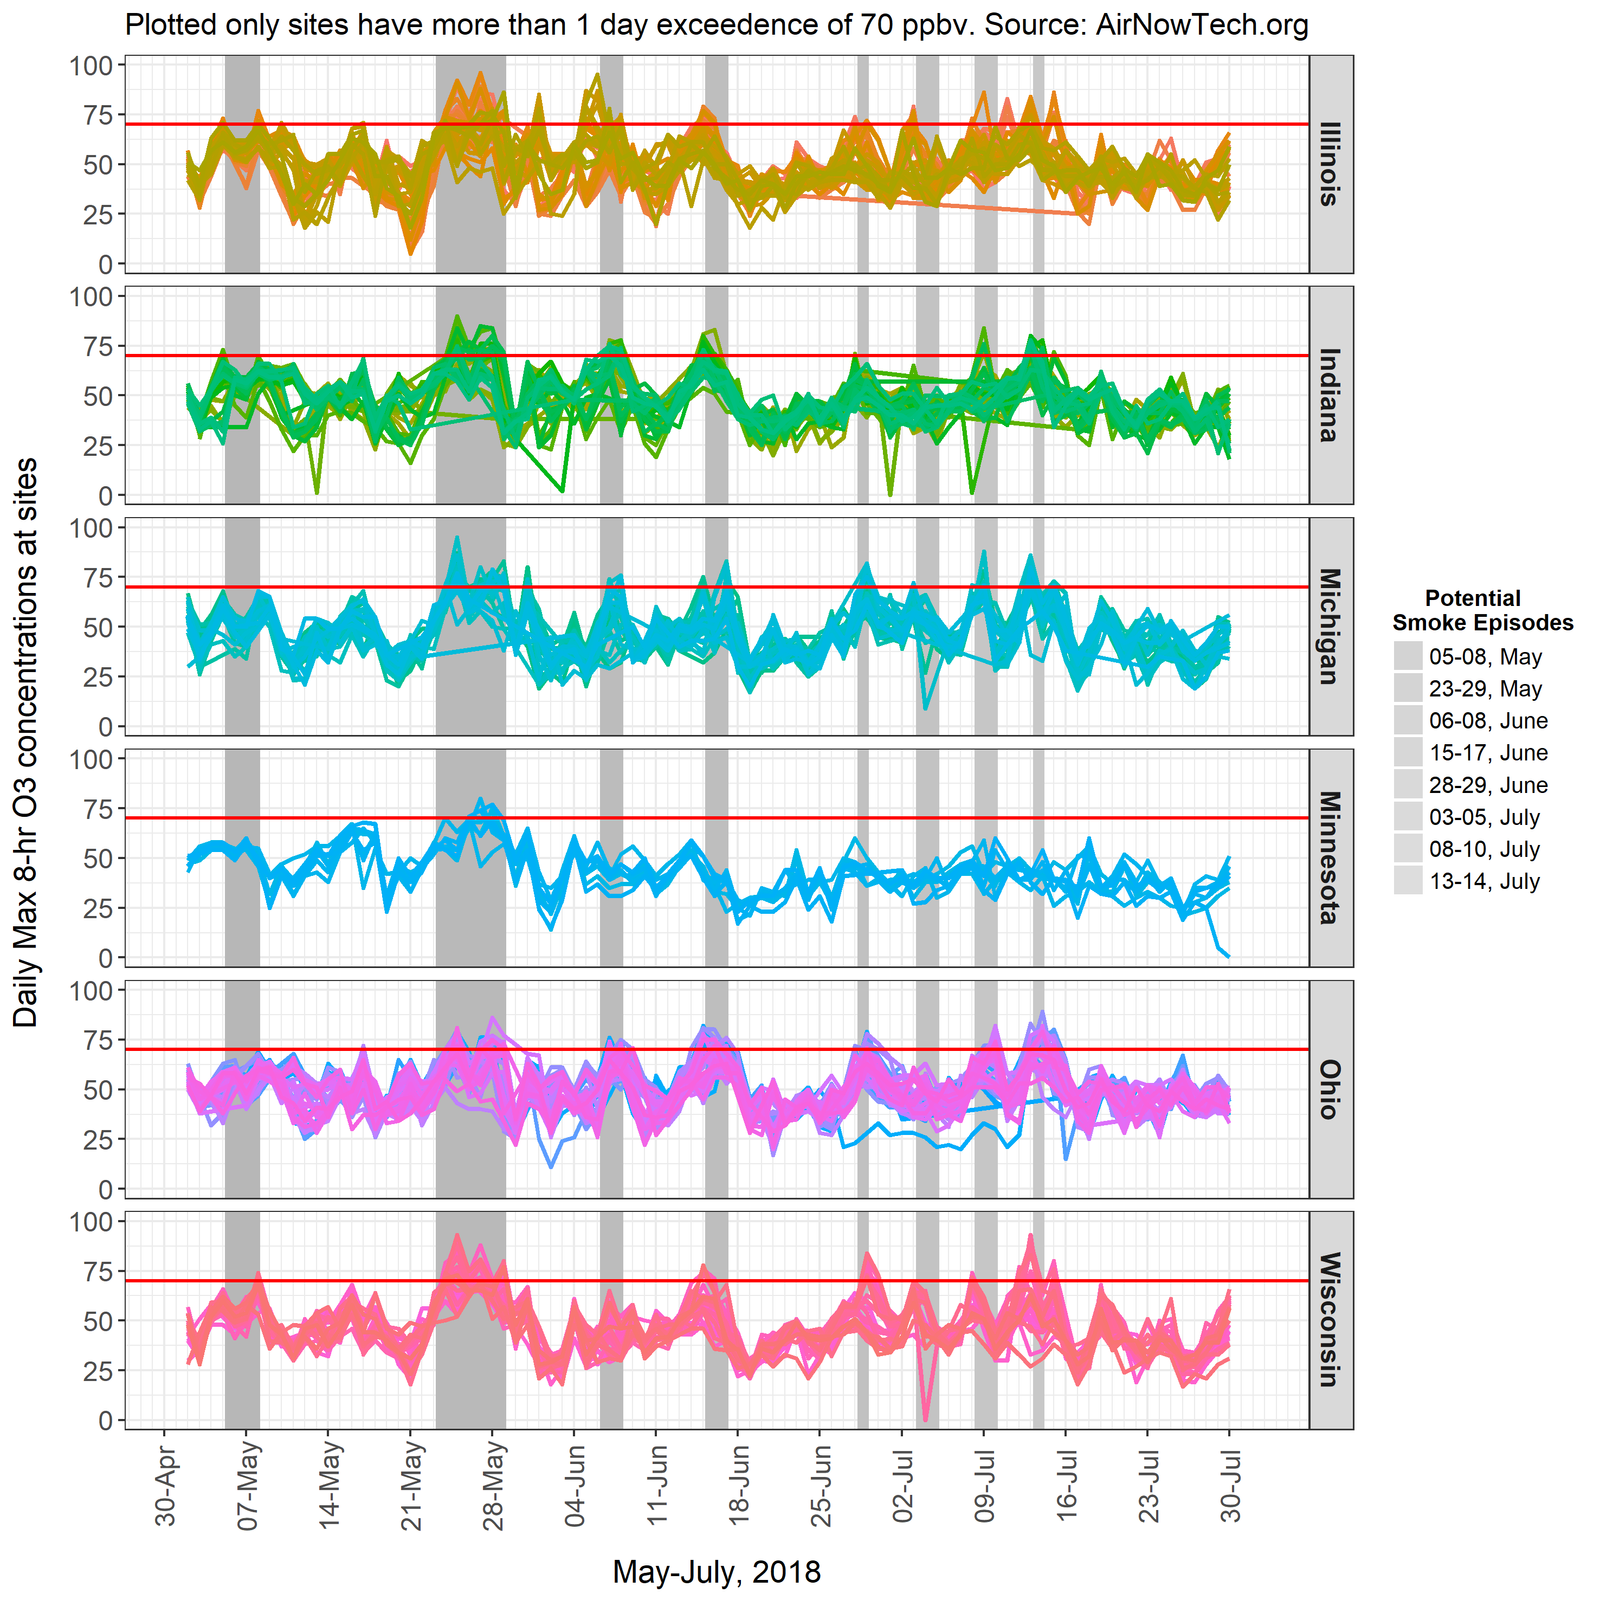
These plots will be updated through the season in advance of the monthly calls. Note that ozone doesn’t appear on these plots until one of the monitors in the screening area violates the 2015 NAAQS (>70 ppb).
Chicago IL-IN Nonattainment Area

Cincinnati OH-KY Nonattainment Area

Cleveland OH Nonattainment Area

Columbus OH Nonattainment Area

Detroit MI Nonattainment Area
Louisville KY-IN Nonattainment Area

Indianapolis-Central Indiana
Northern Indiana

St. Louis MO-IL Nonattainment Area

Western MI Nonattainment Area
Wisconsin Shoreline Nonattainment Area
2020 Call Notes
Click to expand/collapse the call notes below
Action Items
Call Agenda
- Roll
- Document potential smoke-enhanced O3 events in the 2018-2020 period
- Discuss LADCO EE RFP scope
Call Notes
Roll
- MN, IW, IN, MI, OH, EPA R5, LADCO
Document potential smoke-enhanced O3 events in the 2018-2020 period
- May 21-28, 2018
- June 15-17, 2018
- July 6-9, 2019
- July 22-29, 2019
- June 15-20, 2020
- August 22-27, 2020
Discuss LADCO RFP Scope
- How do we select episodes for analysis in EE demo?
- Let the contractor review dates and weigh-in on the strongest cases
- Will the dates coincide with what we’ve been looking at in this workgroup?
- Let contractor decide best cases to review
- We’ve done screening, but don’t have enough background to select the dates
- Fixed time periods are part of the DVs, so they should be looking at the same periods
- Should the contractor be looking past the 4th highs?
- Will they look at 2021 critical values, looking beyond the 4th high
- Not at this point, we should keep the scope constrained for this project
- EPA Region 5
- How to engage with EPA and what timing?
- EPA R5 to consider EE and reivew/approve Chicago redesignations
- States are going to make their best shot in terms of approvabilty
- States seeking approvability potential by EPA R5
- EPA is looking at high O3 days in 2018 and they’re not seeing a clear and causal relationship
- Want to make sure EPA isn’t encouraging LADCO to invest resources if theres is no probability of success
- Is the first step having the contractors select dates and then seek probability that EE demo will be approved by EPA?
- EPA has an analysis of smoke impacts for the region for 2018-2020; will schedule a presentation for next week; EPA R5 to present their analysis
- Are we only focused on Chicago?
- OH has no event’s for Cleveland, but interested to hear EPA thoughts on Chicago
- IL has no events for St. Louis, it’s almost meeting the standard
- WI still trying to understand the EE process; are we demonstrating smoke impact on exceedance or smoke impact on elevated ozone
- EPA revised the EE rule several years ago, before the revision you had show the event caused the exceedance: “but for” the smoke event there would not have been a exceedence
- with revision, removed “but for” demonstration, just have to show clear causal connection between smoke event and exceedance
- still a high bar to show that the smoke impacted the monitor, e.g., similar day analysis what the ozone looked like on similar days without the smoke
- Does there need to be regional modeling?
- For each event can determine the level of information needed; modeling is an option but it’s not needed;
- modeling for weight of evidence used forecast modeling that didn’t predict ozone exceedance because it didn’t account for the impact of smoke
Action Items
Call Agenda
- Roll
- Review August O3, PM, and smoke maps
- Document potential smoke-enhanced O3 events in the 2018-2020 period.
Call Notes
Roll
- MN, IW, IN, MI, OH, EPA R5, LADCO
Review July-August 2020 O3, PM and smoke maps
- See the 2020 EE screening results above
Document potential smoke-enhanced O3 events in the 2018-2020 period
- May 21-28, 2018
- June 15-17, 2018
- July 6-9, 2019
- July 22-29, 2019
- June 15-20, 2020
- August 22-27, 2020
Action Items
Call Agenda
- Roll
- Review June Action Items
- Review June O3, PM, and smoke maps
- CALIPSO analysis of May 2018 O3 episode
- EE analysis products discussion
Call Notes
Roll
- MN, IW, IN, MI, OH, EPA R5, LADCO
Review June Action Items
- Zac: draft workgroup charter for review by states; status: in process
- Zac: present CALIPSO analysis of May 2018 episode; status: done
- Donna: set the legend on the heat maps to show 70 ppb as yellow and set a fixed scale across all plots; status: done, link to updated plots
- States: think about the analysis products that LADCO can be working on to support their EE work; be prepared to discuss on the next call
Review June O3, PM and smoke maps
- See the 2020 EE screening results above
- Chicago, N. Indiana, Indianapolis, Wisconsin shoreline, and W. Michigan sites all trigger the screening metric for the June 15-20 smoke enhancement; possible exceptional event
- WI screening analysis does have CO for June episode, and see a 2 std deviation anomaly in shoreline WI sites
- WI asks about elemental carbon residence time in the atmosphere; while EC does oxidize, its residence time should be pretty long, but not sure of the actual number
CALIPSO Analysis
- Presentation slides
- May 2018 episode had both southerly flow typical of a regional ozone event, and back trajectories pointing to a smoke plume north of the region
- CALIPSO curtains show that there were aerosols present near the surface before and during the event
- Need to look at night-time monitors because the boundary layer constrains the aerosols closer to the surface and it may be easier to “see” the smoke intrusion during the nighttime hours
State Updates on EE Demonstrations
- WI: not looking at any specific dates for an EE demonstration, but doing analysis of days in 2017-2019
- MI: submitted a notification to EPA R5 for the May 2018 episode; also looking at July 2019, but technical analysis is not yet completed; looking at 2020 O3 season to determine regulatory significance of these events, and whether to proceed with the demonstrations
- IN: not looking closely at doing and EE demo, but are tracking some episodes; looking closely at regulatory significance of May 2018 and June 2020 episodes
- MN: not looking to do an EE demo because of no attainment issues, but looking at smoke impacts on forecasts
- OH: looking at May 2018, June 2018, July 2019, and June 2020; regulatory significance is a deciding factor; won’t know until the end of the 2020 O3 season
Action Items
- Zac: draft workgroup charter for review by states
- Zac: present CALIPSO analysis of May 2018 episode
- Donna: set the legend on the heat map to show 70 ppb as yellow and fix the scale across all plots
- States: think about the analysis products that LADCO can be working on to support their EE work; be prepared to discuss on the next call
Call Agenda
- Roll
- Review May Action Items
- Review 2018-19 ozone episode plots
- Review April-June O3, PM, and smoke maps
- EE screening tool review and discussion
- Regulatory Significance Discussion
Call Notes
Roll
MN, WI, IL, IN, MI, EPA R5
Review May Action Items
- Zac: change June call date from 6/2 to 6/9; status: done
- Zac: discuss scope of EE workgroup with Air Directors; status: pending
- Zac: set objectives of the EE workgroup in 2020; status: done, see LADCO EE webpage
- Donna: compile list of 2018 and 2019 ozone episodes by LADCO NAA; status: done
- Tsengel: flag 2018 and 2019 ozone episodes if there is a potential smoke enhancement; status: pending
- Zac: circulate updated regulatory significance analysis spreadsheet to the states; status: done, see notes from May call
Workgroup Discussion
- OH, IL, and MI are looking at a late May 2018 period for an EE demo; where can LADCO help with a regional demonstration?
- Although the smoke never passed directly over the region, back trajectories from the NAAs link to the smoke plume
- Can we look at CALIPSO to see if the aerosol plumes reached the surface in the NAAs?
- MI sent an initial note about the July 2019 episode to EPA R5
- Zac to work on a charter for this workgroup and will be looking for feedback from the members on the charter
- Need to better define information flow and guidance from the air directors and TOC to the workgroup
- States would like to see LADCO help with using remote sensing data (like CALIPSO); Zac to revisit this on the July call
- What can LADCO help with for a regional EE demo
- Data analysis
- Modeling: regional AQM sensitivities and trajectory modeling
- Facilitation and planning
- Contracting
- Need to get some direction from the air directors and/or TOC on the extent of the effort that LADCO should be putting into supporting a regional EE demo
- Need to define the scope/contents of the demo, and where LADCO can contribute to different components
Review 2018-19 ozone episode plots
- Link to Google Drive with plots
- 2018-19 ozone data Excel sheet
- Needle plots (2018 plot | 2019 plot) shows the number of sites exceeding in each nonattainment area (NAA) on each day of the ozone season
- Heat map plots show the high ozone days across sites in the NAA for 2018 and 2019; example: Chicago 2018 heat map
- Set the legend on the heat map to show 70 ppb as yellow and fix the scale across all plots
- Annual heat maps shows the NAAQS exceedences for all NAAs in the region by year (2018 plot | 2019 plot)
- Timeseries plots show all of the sites in each NAA as an ozone season timeseries superimposed with the 2015 O3 NAAQS std; example: Chicago 2018 timeseries
Review April-June O3, PM, and smoke maps
- June has had a few regional high ozone events
Action Items
- Zac: change June call date from 6/2 to 6/9
- Zac: discuss scope of EE workgroup with Air Directors
- Zac: set objectives of the EE workgroup in 2020
- Donna: compile list of 2018 and 2019 ozone episodes by LADCO NAA
- Tsengel: flag 2018 and 2019 ozone episodes if there is a potential smoke enhancement
- Zac: circulate updated regulatory significance spreadsheet to the states
Call Agenda
- Roll
- Review the scope of this WG
- Review where we left off in 2019, including action item review from the 2019 Project Team In-person meeting
- Report from a national air quality modeling performance evaluation workgroup on long-range smoke transport
- Review regulatory significance and EEs
- Look at the top 10 ozone events in each NAA in the 2018 and 2019 ambient record and identify if any of those days could qualify for an EE demo; anticipating the 2020 DVs that will go into the 2021 determination of attainment
- Pivoting to look at the air quality impacts of the pandemic response
Call Notes
Roll: MN, WI, IL, IN, MI, EPA R5
Review the WG Scope
- MN: forecasters looking at smoke when there’s a yellow or higher AQI day, nothing more
- WI: screening procedure built in 2018; 2018 didn’t identify any days to pursue an EE demo; 2019 didn’t have many significant regulatory impacts so didn’t pursue anything
- IL: no work since last year
- IN: haven’t pursued anything mainly because 2019 was such a low ozone year
- MI: submitted to EPA mods for EE at the end of March 2020: May 2018 and July 2019; based on monitoring and analysis of smoke, felt they had a case to make; were able to flag 2019 data in AQS, didn’t flag the 2018 yet; mod request to EPA was a precursor to a potential EE demo
- How did you find smoke in the air? looked at models and websites, and LADCO screening metrics; didn’t use aethalometer data
- EPA R5: it’s been a little while since EPA looked at the regulatory significance spreadsheet; Zac needs to forward this along to the states; will share some ideas for data visualization tools
Review 2019
2019 LADCO Project Team Meeting EE Action Items
- Identify potential EE episodes in the 2018 and 2019 ambient data record
- Identify periods in the monitoring records where there is potential for regulatory significant impacts of EE’s
- Define what’s needed from states in an EE demonstration (this is in the guidance)
- Develop a conceptual approach for a region EE demonstration; when it would apply, who needs to be involved, how to designate roles for different EE demonstration elements, what can be done regionally vs just by individual states
Long Range Smoke Transport WG
Regulatory Significance
Pandemic Air Quality Changes
- Need to ask the Air Directors if this is something that we should be focusing on
- Media requests for some states
- MN and IN have been looking at satellite data and monitors;
- IN for NO2 2020 has been low for NO2 around Indianapolis; seeing some decreases from the shut down but not as large as expected
- Looking at NASA obs from space looking at 2020 vs 5 year average to eliminate met variability
- WI looking at 2017-19 to 2020 to try to eliminate interannual variability; seeing big impact in CO and NO2 at Milwaukee near road monitors
- TropOMI mid-March to Mid-April in 2020 vs 2019, saw some NO2 increases in 2020 because there transport differences
2019 Analysis and Call Notes
Objectives of the 2019 EE workgroup:
- Identify potential EEs for ozone and PM2.5
- Refine the screening metric
- Learn how to integrate other data, including satellite data into EE screening
- Learn from other areas/states that have conducted EE demonstrations
2019 EE Screening Results (as of October 3, 2019)
These plots will be updated through the season in advance of the monthly calls. Note that ozone doesn’t appear on these plots until one of the monitors in the screening area violates the 2015 NAAQS (>70 ppb).
Chicago IL-IN Nonattainment Area
Cincinnati OH-KY Nonattainment Area
Cleveland OH Nonattainment Area

Columbus OH Nonattainment Area
Detroit MI Nonattainment Area
Louisville KY-IN Nonattainment Area
Indianapolis-Central Indiana

Northern Indiana
St. Louis MO-IL Nonattainment Area

Western MI Nonattainment Area

Wisconsin Shoreline Nonattainment Area

2019 Call Notes
Click to expand/collapse the call notes below
Call Agenda
- Roll
- Review 2019 smoke and air quality data to date on AirNowTech and with LADCO screening
- Report out on the EE discussion at the LADCO Annual Project Team meeting
- Discussion on regional EE demonstration
- Discussion on determining regulatory significance
Call Notes
Review Air Quality Data
- August-September ozone events (>70 ppb)
- August 2 – Chicago and St. Louis
- August 3 – Chicago, Davenport, and Peoria
- August 4 – Cleveland
- August 5 – St. Louis, N. Indiana, Louisville, Cincinnati
- August 12 – Detroit
- August 19 – St. Louis, Cincinnati
- September 10 – Cincinnati
- September 18 – St. Louis
- September 19 – St. Louis
- September 20 – Milwaukee, Indianapolis, Cincinnati, Ft. Wayne
- Smoke
- August 1-4
- September 3-7
- September 16-20
- Smoke and high ozone events to note
- Cincinnati – August 1-4
- Indianpolis – September 16-21
Report out on the EE discussion at the LADCO Annual Project Team meeting
- Session slides (slides 23-28)
- Session Action Items
- Identify potential EE episodes in the 2018 and 2019 ambient data record
- Identify periods in the monitoring records where there is potential for regulatory significant impacts of EE’s
- Define what’s needed from states in an EE demonstration (this is in the guidance)
- Develop a conceptual approach for a region EE demonstration; when it would apply, who needs to be involved, how to designate roles for different EE demonstration elements, what can be done regionally vs just by individual states
- Session Notes
- LADCO summarized the work of the EE workgroup, meeting frequency, screening metric, thoughts on path forward
- What are the states thinking about with regard to EE demonstrations/applications?
- OH: looking at ozone on a daily basis, and estimating what would happen if what happens if you excluded the day from the DV record; trying to figure out if triggering a contingency measure means regulatory significance
- Want to pursue a regional approach to EE demonstration if one is needed, and how do we do this so each state doesn’t have to do it on their own
- Regulatory significance may not become apparent until later
- Trying to figure out how to identify reg significance after the fact
- Have not done a retrospective analysis of past ozone seasons
- MI: EE identification is a good process for looking at data in real-time, but not doing it at EGLE; looking historically (past ozone seasons) may not be very valuable; appreciates the team meeting regularly, interested if there is an EE to flag the data; looking every couple of weeks, valuable to continue this effort but don’t know how helpful it’s been; need to keep this as an option moving forward; trying to stay out in front of the issue
- MN: is not looking at EE applications since they don’t have NAA issues; meteorologists looking at the AQI, when they find air quality smoke, connect with monitoring data to flag the events
- Manufacturing associations have met with R5 admin; their focus was on 179b but also highlighted EEs; EPA told manufacturers that they need to work with their states
- IN: Regional approach – makes sense to evaluate regionally, but may not have regional impacts; with developing and petitioning, the onus is on the state; from the evaluation standpoint having a regional approach adds credibility to the process to flag events moving forward to pursue more detailed tech analysis
- There is good technical expertise on the WG; the members should figure out the regional approach on a case-by-case basis, someone will need to dedicate time to it
- OH: looking at ozone on a daily basis, and estimating what would happen if what happens if you excluded the day from the DV record; trying to figure out if triggering a contingency measure means regulatory significance
- Suggestion that the workgroup spends time identifying where they think there could be an event that’s a candidate for a demonstration; bring it to the Project Team to help identify where the work needs to be done, and get commitments from state staff; states need to know what is needed for an EE demo, then designate regionally the pieces;
- Look at the top 10 ozone events in each NAA in 2018 and 2019 ambient record and identify if any of those days could qualify for an EE demo; anticipating the 2020 DVs that will go into the 2021 determination of attainment
- Last call asked the states to present the events that they think there is reg significance
- Need to know, what are the components and who can work on it
- LADCO wants the EPA to help with EE flagging in the monitoring data; similar to the anthropogenic impairment approach with regional haze, we should be able to identify a systematic and automated, observation-driven approach to auto-flag monitoring data for potential smoke impacts
2018 EE Demonstration Discussion
- OH EPA looking at 2018 dates for EE demo: May 23-25, June 15-17, July 12-14; eliminating data from these periods could help with attainment
- IN looking at May period, but questions about reg significance
- Could there be interest in other MJOs, NY? WV? that could benefit OH in this work if there is no regional interest; LADCO to check interest in other regions for these periods in 2018
Discussion on determining regulatory significance
- Thinking about trying to automate the determination of regulatory significance in the EE context. Could there be a process or algorithm that we may be able to deploy more systematically to identify regulatory significance? LADCO did something along these lines in summer 2018 with that top 10 days spreadsheet, but it was manual and rather qualitative. Could evolve this process into something more automated. Are any ideas already floating around out there to explore a metric that does something along the lines of: 1) Is it worth pursuing an EE demo for a given non attainment area (NAA), or is the critical DV just too low? 2) If an NAA is in play for an EE demo, how many days/which days need to be removed to put the monitor into attainment? 3) are there potential smoke impairment days that could be explored that would remove days from the DV calculation, and if you remove these does the monitor attain the NAAQS?
- OH: regulatory significance is more than just does it mean the difference between attainment and nonattainment. It could be the difference between marginal or moderate; it could not affect attainment this 3-year period, but maybe would make a difference for the next 3-year period; or as I noted for one of our areas it means the difference between triggering contingency measures and not triggering. So, I think it will still need some manual evaluation but an initial automated cut could be whether the 4th high or DV even changes if the data is excluded. Of course, we won’t know this until the end of the ozone season… the way I’ve been going about it is to note any potential events during the season as they occur, and come back to them at the end of the season to determine regulatory significant
- EPA EE April 2019 Data Modifications Guidance memo identifies regulatory significant and other regulatory program applications for EE demos
Call Agenda
- Roll
- Review August action items
- Using MODIS and TROPOMI Total Column Ozone To Analyze Smoke Events, Michael Geigert, CT DEEP (webinar); download slides
- OH EPA: 2018 EE episodes to consider: May 23-25, June 15-17, July 12-14; discussion on regional EE demonstration
- Review smoke and air quality data to date on AirNowTech and with LADCO screening
Call Notes
August Action Items
- All: think about the fundamental concept of exceptional events given that fires are a routine part of the ozone season; are these really exceptional events? or should they be treated more like biogenic emissions and considered to be part of the natural background? What are the regulatory implications for the states?
- LADCO: post screening metric plots through the end of July, including for N. Indiana and Indianapolis
- Status: done
- LADCO: include a listing of the monthly mean, and daily concentrations by site used to develop the anomaly plots
- Status: done
- LADCO: Add discussion item for next call on 2018 EE’s being investigated by OH EPA
- Status: done
- LADCO: Add Scott Leopold from IL EPA to EE group
- Status: done
CT DEEP Presentation
- Fusing data with RSIG and Panoply
- Recommends looking at CO and O3 columns in addition to surface data
- Look at transport coming in from Asia north of the LADCO region
- What do we know about stratospheric intrusion from the poles?
- Is RSIG real-time?
- It appears to be a real-time feed; near real-time with TropOMI
- How do you draw the line between a smoke enhancements and an EE
- There needs to be a impact on the design values
- Looking at regulatory significance wrt 4th high O3
- Demos focus on determining if smoke is making it to the ground, how much of an effort do you need to make in demonstrating this?
- Look at rural sites away from NAA, show that PM reaching the ground is more widespread
- How do you make the connection between having smoke and elevated ozone? Would like to know the chemistry better.
- If NOAA model is underpredicting by 20 ppb or more, may be an indication of smoke enhancement
- Believe smoke enhancements are something that they’ll be going to live with
2018 EE Demonstration Discussion
- OH EPA looking at 2018 dates for EE demo: May 23-25, June 15-17, July 12-14
Review Air Quality Data
- July ozone events (>70 ppb)
- July 1: N. Indiana and Detroit
- July 2: W. Michigan
- July 3: Chicago and N. Indiana
- July 5: Chicago and W. Michigan
- July 8: Chicago (W. Suburbs)
- July 9: Chicago, Coastal Wisconsin, Green Bay, Kokomo, Indiana
- July 10: N. Indiana, W. Michigan, Louisville, Cincinnati, Cleveland, Detroit
- July 13: St. Louis, Chicago, N. Indiana, Louisville, Cincinnati, Cleveland, Rockford IL, Mt. Vernon IL
- July 14: Indianapolis, Cincinnati, Peoria IL
- July 15: Columbus and Detroit
- July 25: Chicago (N. NAA) and Sheboygan
- July 26: Door County, WI and Cincinnati
- July 27: Port Huron, MI
- July 28: W. Michigan
- Smoke
- July 6-9
- July 12
- July 22-31
Call Agenda
- Roll
- Review July action items
- Data resources update
- Ft. McMurray algorithm validation (see CALIPSO link below)
- CALIPSO aerosol curtains
- Review July smoke and air quality data on AirNowTech and with LADCO screening
Call Notes
July Action Items
- States: send LADCO revised list of sites/locations for applying the screening metric
- IN requested N. Indiana and Indianapolis
- LADCO: contact guests for future EE calls to discuss satellite data and EE demos
- Requests send to AZ DEQ and CT DEEP to make presentations on their EE work
Data Resources Update
- New links added to First Tier Analysis section to this website
- CALIPSO is a vertically-resolve cloud and aerosol satellite retrieval. It can be used to show curtain plots of aloft and near-surface aerosols. Link to archived Google Earth KMZ files to visualize the CALIPSO overpass curtains.
- Archived HMS smoke/fire Google Earth KMZ files and Shapefiles.
Ft. McMurray Fire algorithm validation
- Applied LADCO algorithm to 2016 air quality data and zeroed in on late-May Ft. McMurray fire influence at LADCO monitors
- Cleveland NAA LADCO EE plot shows > 1 sigma anomalies in CO, PM, and O3 in the May 24-25 period, along with smoke in the column on May 22-23
CALIPSO Aerosol Curtains
- Combine CALIPSO with surface smoke
- May 22, 2016 example shows Google Earth image with HMS smoke and fire (columns) + CALIPSO aerosol column (0230 LST overpass)
- Example shows that there was smoke in column on May 22 in the LADCO region; CALISPO overpass puts the smoke (aerosols) aloft just east of the LADCO region
- Link to presentation with additional analysis

Review July Air Quality Data
- July ozone events (>70 ppb)
- July 1: N. Indiana and Detroit
- July 2: W. Michigan
- July 3: Chicago and N. Indiana
- July 5: Chicago and W. Michigan
- July 8: Chicago (W. Suburbs)
- July 9: Chicago, Coastal Wisconsin, Green Bay, Kokomo, Indiana
- July 10: N. Indiana, W. Michigan, Louisville, Cincinnati, Cleveland, Detroit
- July 13: St. Louis, Chicago, N. Indiana, Louisville, Cincinnati, Cleveland, Rockford IL, Mt. Vernon IL
- July 14: Indianapolis, Cincinnati, Peoria IL
- July 15: Columbus and Detroit
- July 25: Chicago (N. NAA) and Sheboygan
- July 26: Door County, WI and Cincinnati
- July 27: Port Huron, MI
- July 28: W. Michigan
- Smoke
- July 6-9
- July 12
- July 22-31
Action Items
- All: think about the fundamental concept of exceptional events given that fires are a routine part of the ozone season; are these really exceptional events? or should they be treated more like biogenic emissions and considered to be part of the natural background? What are the regulatory implications for the states?
- LADCO: post screening metric plots through the end of July, including for N. Indiana and Indianapolis
- LADCO: include a listing of the monthly mean, and daily concentrations by site used to develop the anomaly plots
- LADCO: Add discussion item for next call on 2018 EE’s being investigated by OH EPA (May 23-25, June 15-17 and July 12-14)
- LADCO: Add Scott Leopold from IL EPA to EE group
Call Agenda
- Roll and Introductions
- Review data resources
- State round-table on EE screening approaches
- Review LADCO EE screening analysis products and 2018 final results
- Review May-June smoke and air quality data on AirNowTech and with LADCO screening
- State-Federal Model Evaluation Forum long range transport workgroup
Call Notes
Data Resources
- See the Tools and Data section above for the list of resources currently in use by LADCO and member states for screening for EEs
- Expand to include satellite data
State Round Table
- WI – in 2018 worked an internal EE screening process, log transformed and filtered monitoring data (>2 sigma monthly profiles); screening conducted on a weekly basis; recommends looking at BC data in additional to O3, PM, and CO; in 2019 looking for help on refining the screening metric and on how to use satellite data to support EE screening, in particular how to find when smoke reaches the surface (CALIPSO, CATS); can we get someone to present on using satellites for EE on a future call?
- What other states are operating BC monitors: only IN in the LADCO region are reporting to AirNow; IN has 6 BC monitors across the state
- MN – developed an internal process for flagging monitoring data; not as concerned about O3 and PM from fires, concerns with statewide PM on higher AQI days
- IN – would like to expand screening approaches beyond NAAs to other at risk areas, e.g., Valparaiso; current screening approach for EE focuses on met analysis and whether high ozone is associated with met typically connected with high ozone, if atypical met and high ozone, then it could be an EE; suggest reaching out to AZ about having a presentation on recent EE work
- MI – interested in finding out where to get the best information and tools for EEs; not aware of a screening process currently in place in EGLE
- EPA R5 – watching this forum to anticipate what may be coming from the states to EPA in the future
Review LADCO EE Screening Analysis and 2018 Results
- Presentation on LADCO Analysis
- Normalized monitoring data by month across 5 years 2013-2017 to minimize inter-annual and monthly variability; anomaly plots show when concentrations are high relative to that month, not relative to the entire ozone season
- >1 sigma represents concentrations that are in the top 30% of the observations
- EE potential = smoke + CO, PM25, and O3 > 1 sigma
Review May-June Air Quality Data
- First ozone event in the region on May 30 in MN, appears to be a smoke-enhanced event per the LADCO EE screening metric
- First Lake Michigan ozone on June 5 in N. Indiana; appears to be a smoke-enhanced event per the LADCO EE screening metric
- June 6 in Minneapolis
- After a cooler June, didn’t see elevated ozone until June 26 in Cincinnati and Dayton; no smoke present
- June 27 ozone violations throughout the region (L. Michigan, Indy, Ft. Wayne, Detroit, Cleveland)
- June 27-29: Chicago and Cleveland ozone episode
- June 28: Louisville
- June 29: St. Louis
State-Federal Model Evaluation Forum LR Transport Workgroup
- Workgroup being formed to evaluate EPA 2016 CAMx and CMAQ model performance for long-range smoke transport
Action Items
- States: send LADCO revised list of sites/locations for applying the screening metric
- LADCO: contact guests for future EE calls to discuss satellite data and EE demos
2018 Analysis and Call Notes
Summary: LADCO, the LADCO member states, and EPA R5 held monthly calls starting in August 2018 to review air quality data in the context of identifying potential exceptional events for ozone in the region. Over the course of the ozone season, LADCO, in consultation with the regional EE workgroup, developed a screening metric using readily available monitoring data to identify EE potential in the region. The final 2018 screening results, call notes, and presentations are included below.
2018 EE Screening Results
Chicago IL-IN Nonattainment Area


Cincinnati OH-KY Nonattainment Area


Cleveland OH Nonattainment Area


Columbus OH Nonattainment Area


Detroit MI Nonattainment Area

Louisville KY-IN Nonattainment Area
St. Louis MO-IL Nonattainment Area


Western MI Nonattainment Area


Wisconsin Shoreline Nonattainment Area


2018 Call Notes
Click to expand/collapse the call notes below
Call Agenda
- Roll
- Review data for October
- Outstanding Action Items
- Next Steps
Call Notes
- October was a quiet month for air quality in the region, no need to review these data
- LADCO to follow up on the action items from last month to create the updated standardized O3/NOx/CO plots for every NAA in the region, including data from April – October
- Create metadata for each plot that describes the monitors that went into creating the plots by NAA
- Exceptional event demonstration presentation at CMAS
- Critical review of ozone production from wildfires (Jaffe and Widger). Describes the use of chemical ratios for identifying fire impacts.
- Group is ending for 2018, LADCO will reconvene in May 2019
- LADCO encourages group to keep an eye out for data, studies, reports that may be helpful in our development of approaches and discussion on screening for EEs
- This website can serve as a central resource base for this project.
Action Items
- LADCO: schedule call for May 2019
- LADCO: create standardized timeseries for all of the NAA’s in LADCO region
- LADCO: send list of CO, PM25, and O3 sites that are being used to create standardized timeseries in each NA
Call Agenda
- Roll
- Refined analysis: Standardized O3, PM2.5, CO time series, and smoke events
- Review data for September
- Thoughts on our next steps: Beyond October, past years?
Call Notes
Refined analysis: Standardized O3, PM2.5, CO time series, and smoke events
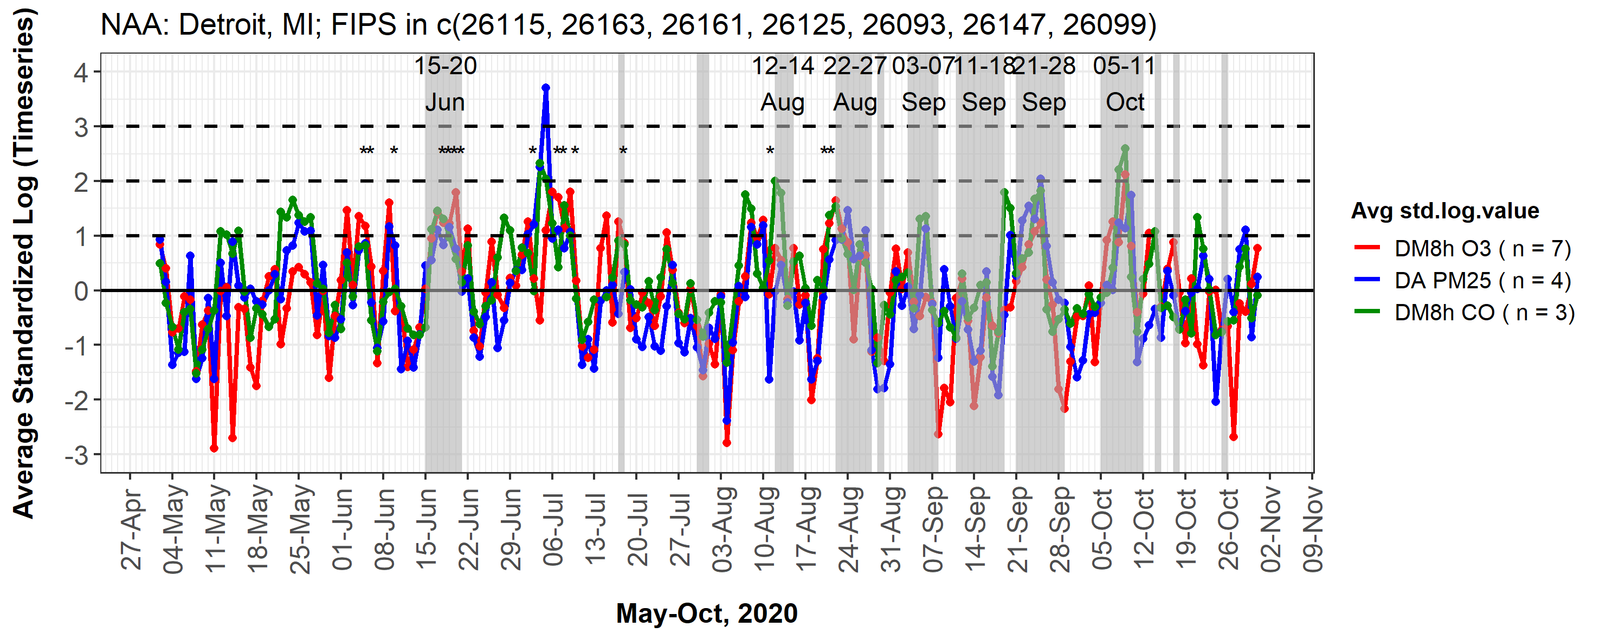
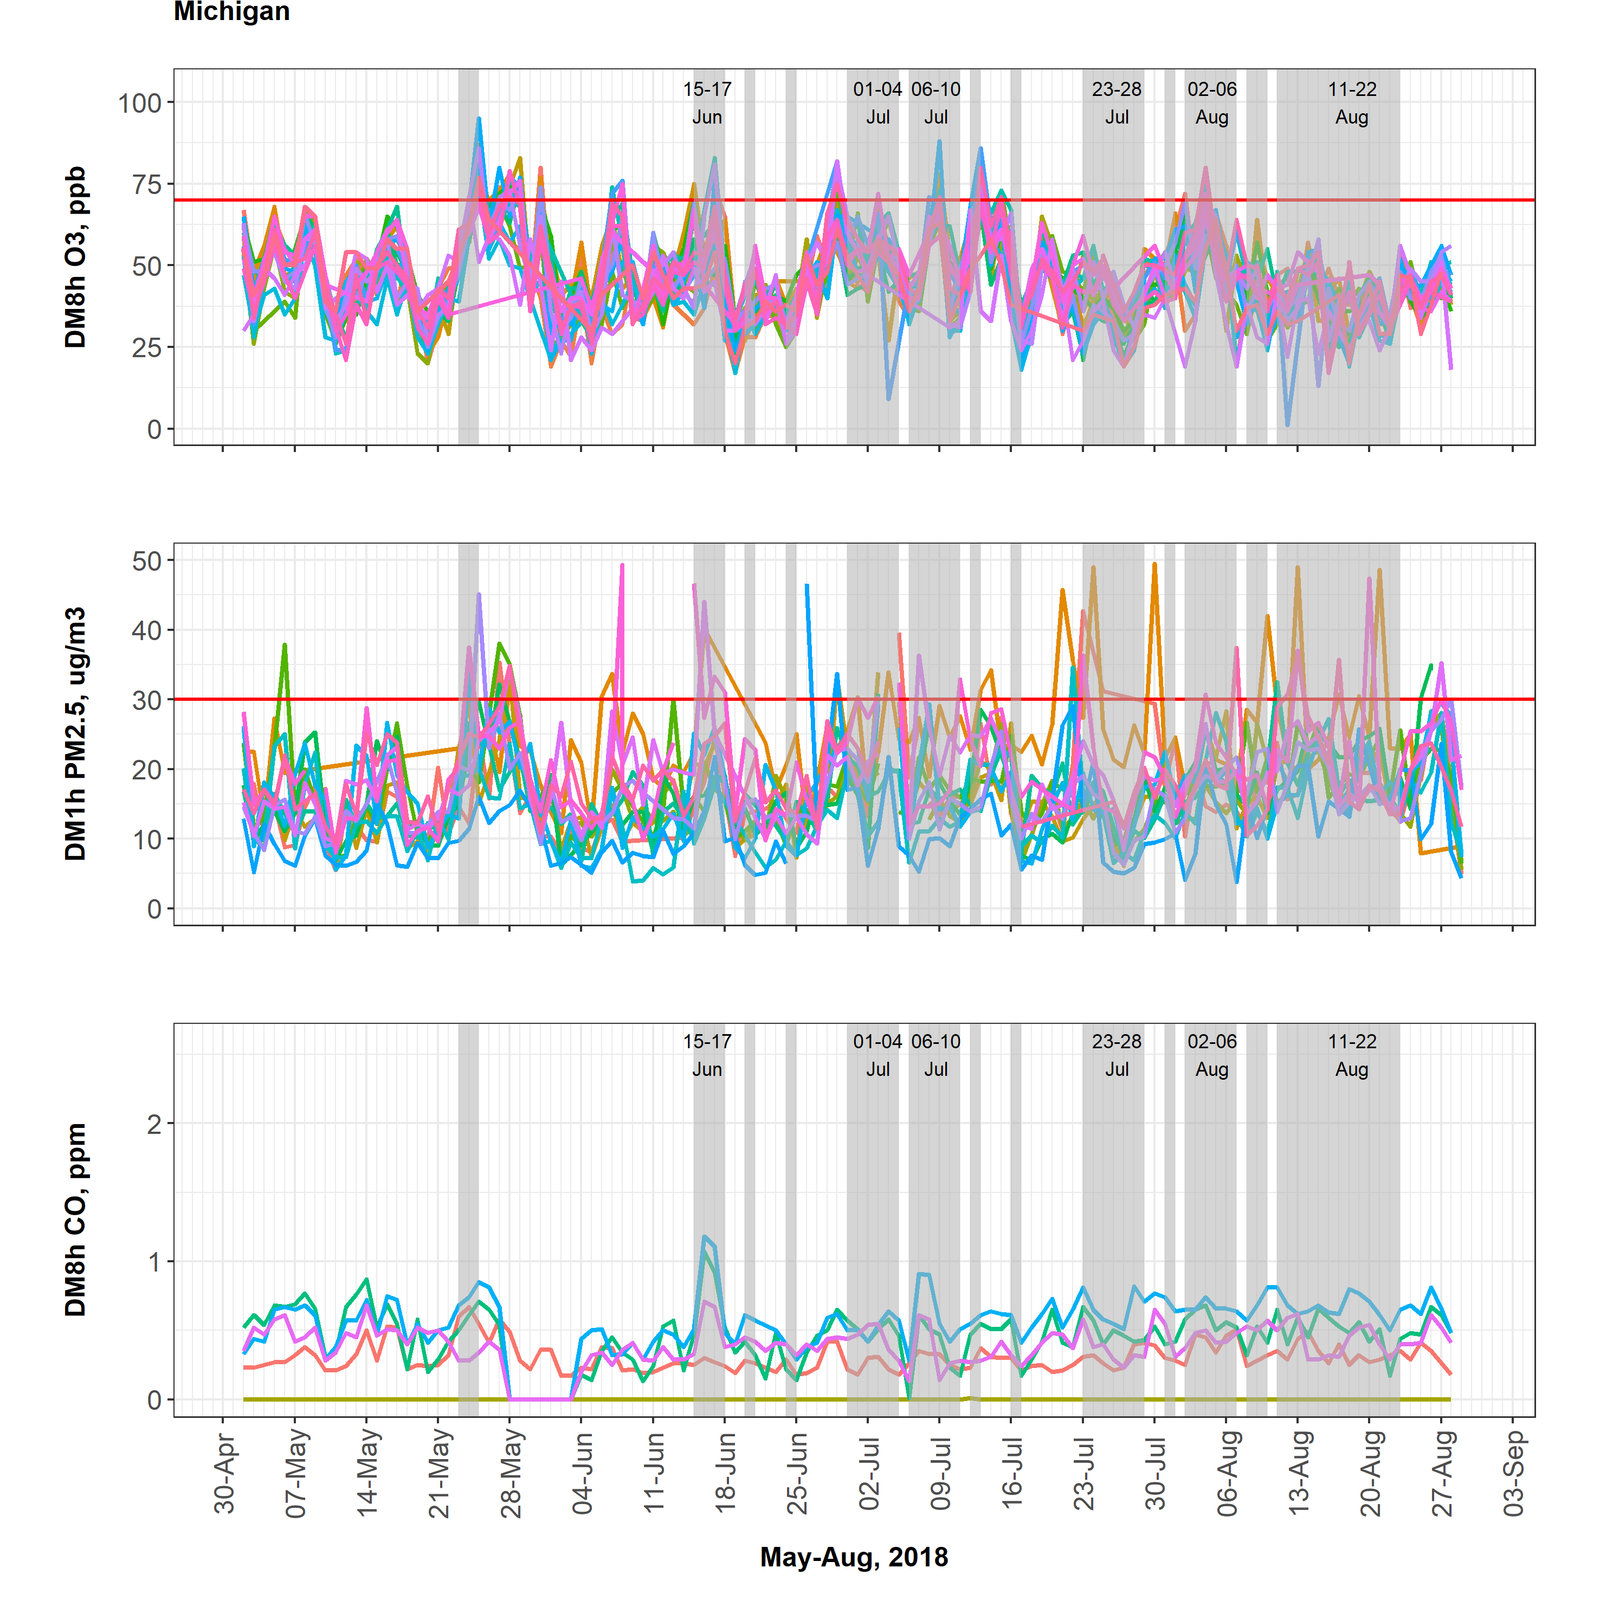
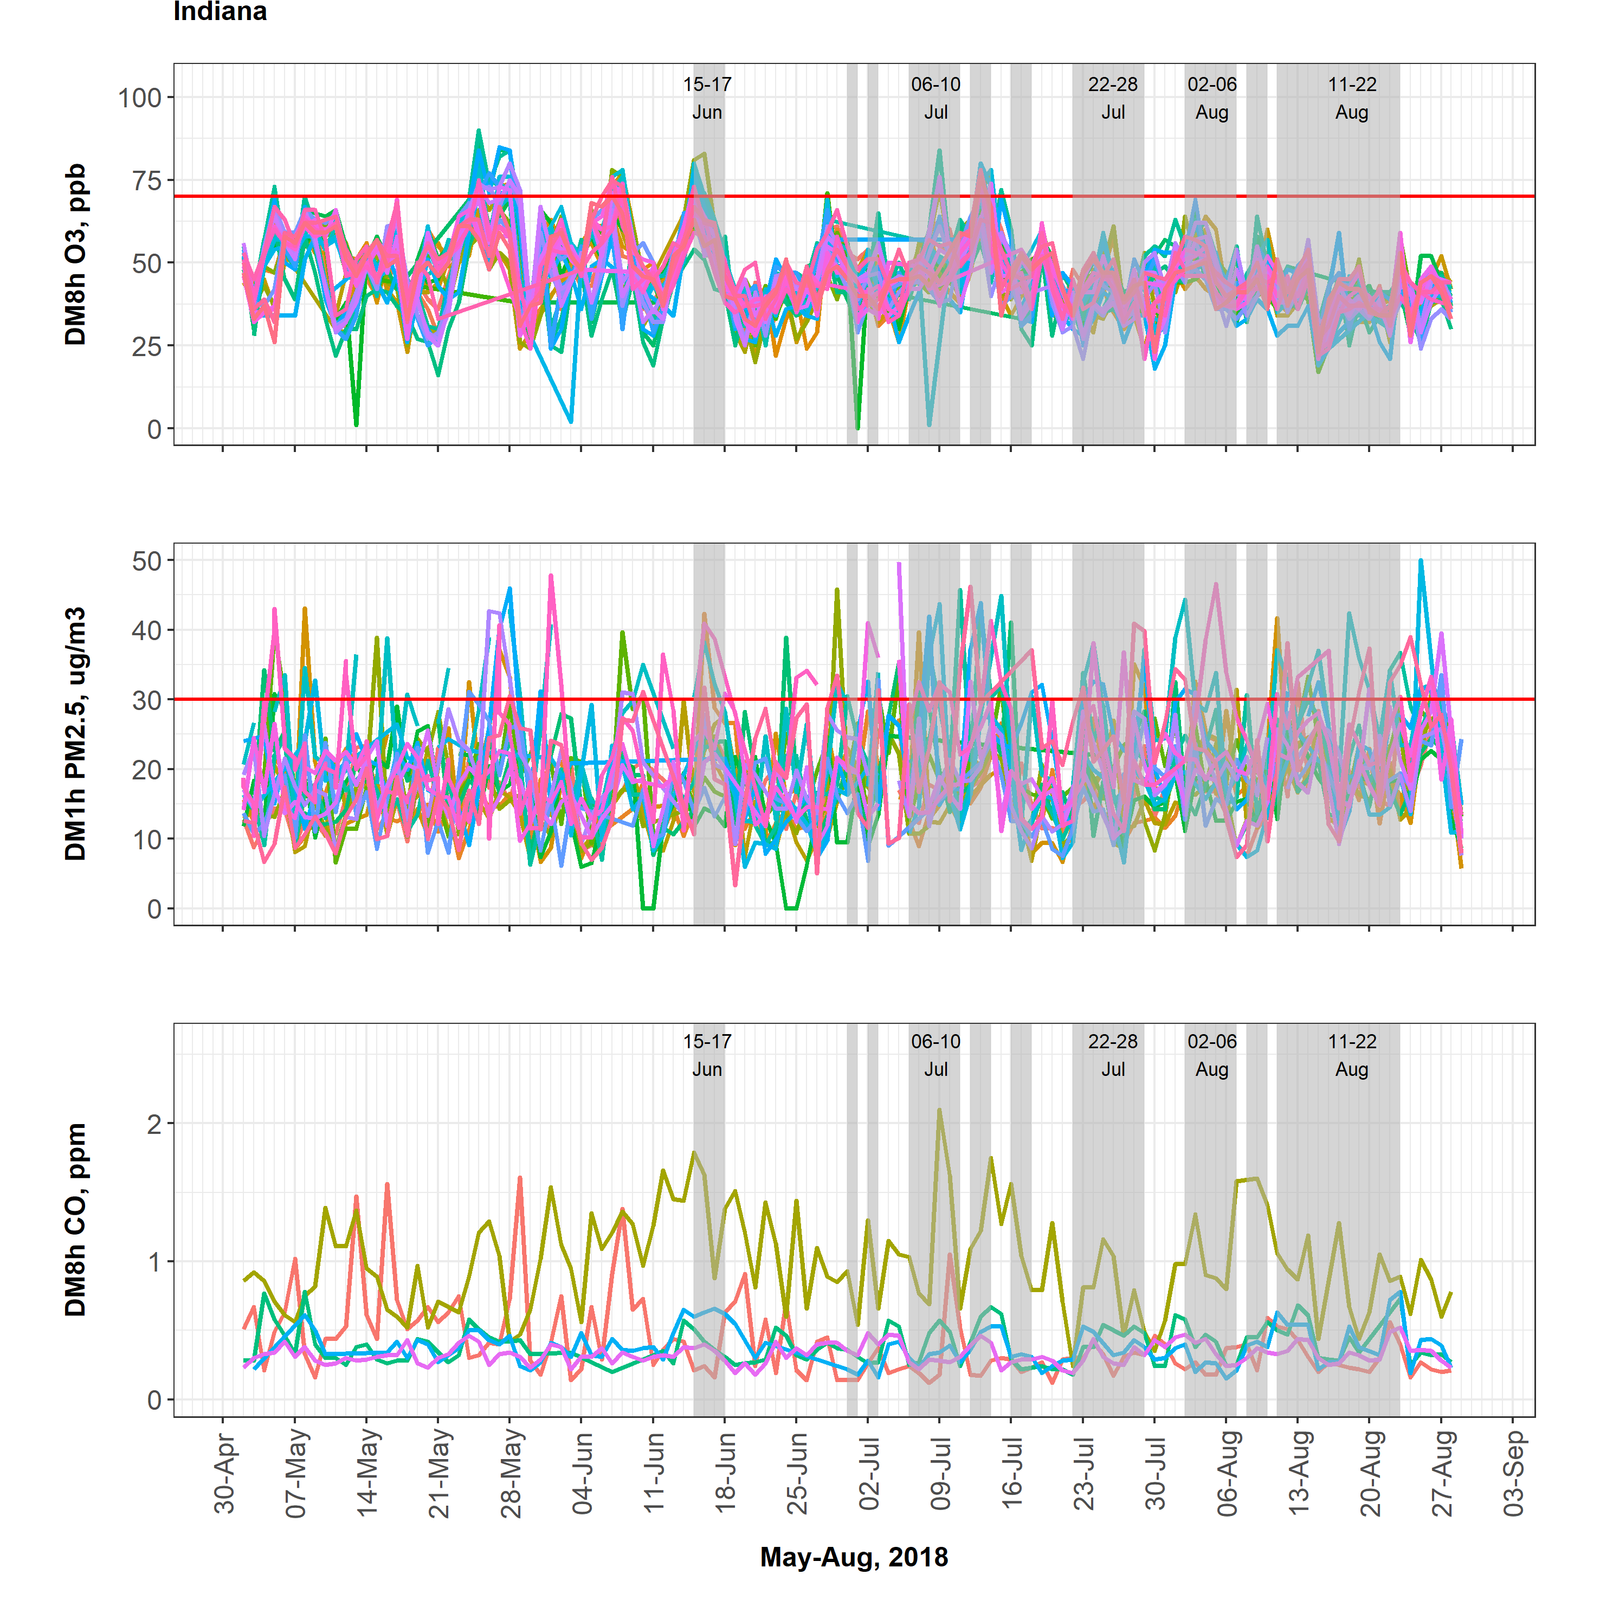
The plots below show summary of O3, PM2.5, and CO standardized time series in the NAA along with potential smoke events during the O3 season of 2018. The data are standardized by the season average of all sites across the NAA. The dashed lines show the number of standard deviations from the mean (above and below) for each pollutant. The plots were generated by NAA: Wisconsin Shoreline, Chicago, Detroit, and Western MI.
Notes:
- These plots are consistent with similar analysis performed by WI DNR
- Q: Are these standardize across multiple years, or a single year
- A: Standardized by May 1-August 31 2018 averages
- Suggestion to look at maximums for sites, in addition to averages; LADCO points to the plots by site below that include the mean and site averages
- Note that the monitors that went into these plots are listed in the next set of plots below
- WI notes that they have looked at aethalometer data for black carbon (BC), looking for elevated BC; ratios of active organic carbon/BC can be helpful to highlight local vs remote smoke sources; there are two aetholometers in the WI DNR network
- WI would like to see these plots made for 2017; looking at Sept 22-25, 2017 as potential for EE ozone enhancement
- Need to revisit the standardization; WI and LADCO note that the amplitude of ozone changes by month and should consider standardizing by monthly average instead of across the season; looking across multiple years may not make sense because of differences in the number of smoke days and impact of anthro sources; 2018 had the most # of smoke days in recent years in WI, similar to 2017 but different from previous years


The plots below show standardized O3, PM2.5, and CO time series for the individual sites in the NAA. The black solid line in each panel shows the average of the all time series for the particular variable. The data are standardized by the season average of the observations at each site. These plots show the monitors that went into creating the average standardized O3, PM2.5 and CO time series for each NAA shown above
The plot below shows the hourly NOx, CO, and CO/NOx ratio for the I-70 site in Indianapolis. The dashed line shows the ozone exceedance days.
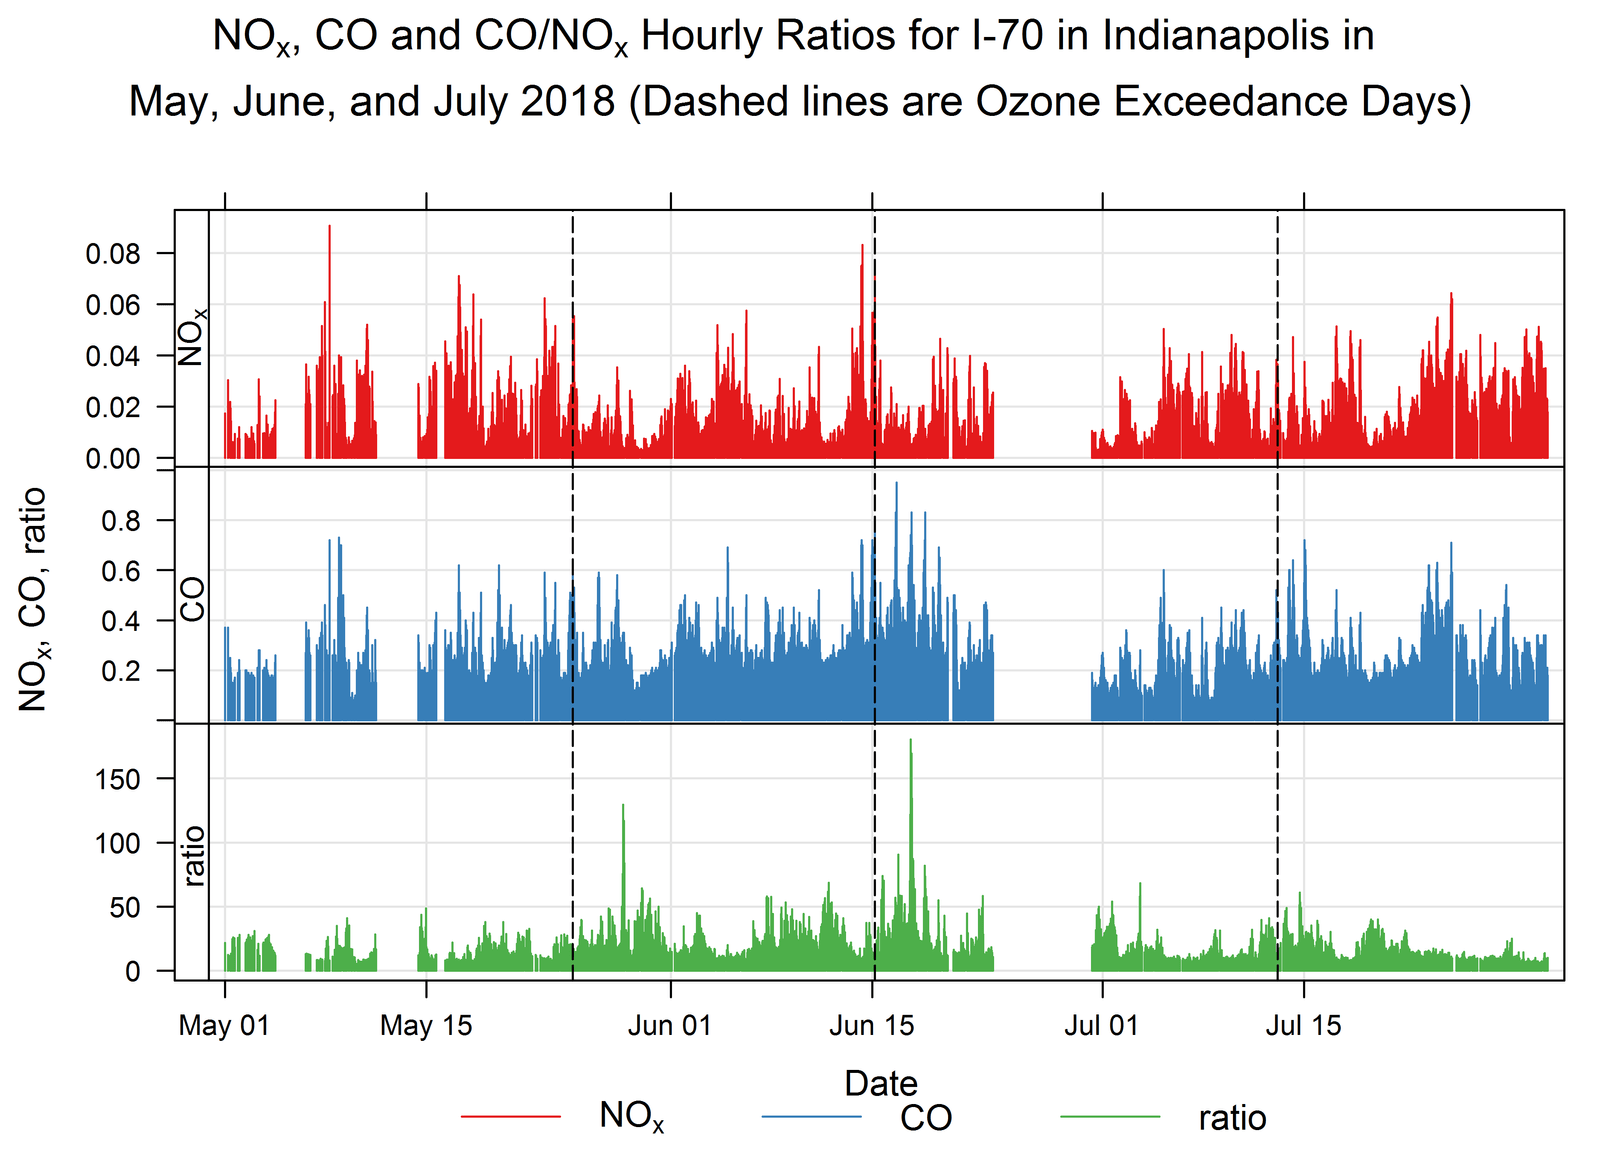
Download CSV of the Indianapolis data.
Review Data for September
September had more PM than ozone issues. Some moderate/high ozone mid-month in Cincinnati, Louisville and St. Louis NAAs but did not appear to be impacted by smoke.
Thoughts on Next Steps: Beyond October, past years?
Meet in November to look back the last month of the regional ozone season and to review September 2017 data. Will meet Thursday 11/8 @ 1:00 Central.
Action Items
- LADCO: schedule call for Thursday 11/8 @ 1:00 Central
- LADCO: hide this page behind a password (LADCO Internal)
- LADCO: update standardized timeseries to extend beyond 8/31 through October
- LADCO: update standardized timeseries to include CO and PM sites in MI
- LADCO: create standardized timeseries for all of the NAA’s in LADCO region
- LADCO: send list of CO, PM25, and O3 sites that are being used to create standardized timeseries in each NAA
- WI DNR: send slides with aethalometer and other EE analyses, as available
Call Agenda
- Roll
- Refined analysis: Review O3, PM2.5, CO, and smoke time series
- Review data for August
- Regulatory significance Discussion
- Thoughts on our next steps: Beyond October
Call Notes
Refined analysis: Review O3, PM2.5, CO, and smoke time series


- Create normalized (anomaly) plots for different pollutants
- Add layer to ID sites
- Are we going to extend to PM2.5 as well? We don’t have many NAA’s; look at annual data
- Instead of looking by state, it muddies the geographic view, group by NAA or metro area, or by region of the state, to keep things in the same geographic area
- Can we also look at K+ and EC, UV-Carbon; what other surrogates
Review data for August
- IN: August dominated by PM2.5
- MI: consistent moderate O3 values; 4 exceedances for O3; higher PM than normal but no exceed.
- August 20, high PM in MN
- August 25 and 26, exceedance (consider regulatory significance)
Regulatory significance Discussion
Review Top 10 days spreadsheet.
- Can we exclude multiple days?
- Can we simplify this analysis: will the 4th high change if you take out a day or two
- Based on the current how many EE demos to change the status of the monitor?
- Show the 2018 DV with 5th, 6th, 7th, 8th high
A draft approach and list of resources are presented above to get the EE workgroup started. A couple of action items before the call:
- Please review the approach, including the workflow that I propose for our meetings/analysis
- Be prepared to discuss your own state approach, describing what data sets you use and how you’re looking for exceptional events
- Create a login on AirNow Tech, if you don’t already have one. It takes anywhere from an hour to a day or so to get your request approved
Call Agenda
- Roll and introductions
- Review LADCO workflow
- Discuss state approaches to EE identification
- Review data for May – July
Call Notes
Review LADCO workflow
- IN: agrees with triage call approach; looking at smoke and where ozone may be impacted; likes the idea of creating consistency in the region for analysis
- WI: Generally plan sounds good, looking at event in late sept (22-24/2017), looks like it may be an event impacting O3, weird time of year for high ozone; can we also look into this to help WI; add it to the list, 1-2 of these days were in the top 1-2 days at the sites; may be useful for redesignation requests; hot period but typically not high during these days
Discuss state approaches to EE identification
- MN: not in danger of exceeding, using a lower key approach; create own AQI, and have a procedure for forecaster to flag days that may have a smoke component; looking at smoke overlays and focusing on days that are > 35 PM2.5 and > O3 NAAQS and flagging in AQS for preliminary; can use for demonstration later
- WI: Not doing a systematic approach for EE; when they see things that others ID, go to AirNow tech and look at the data; not doing anything systematic right now; intent to use other satellite data as well
- IN: Not an official procedure, spending some time this season looking at smoke and high ozone days; in the past looked at exceedance days, summary reports, back trajectories, and other forecast products; haven’t come up with anything they’ve submitted to EPA; potentially some days in years past; looking for feedback from other states; some events in the forecasting procedures, if see possibility of smoke influence on ozone, mention in discussion points
- OH: no formal procedure, review the monitoring data everyday look at the HMS smoke maps, experimental smoke model from HRRR, different vertical layers, including vertical integrate smoke by hour; HMS smoke map; will share, don’t do any flagging in AQS unless identify EE that they will pursue; under impression that when you flag something need to start a process with EPA to notify them that you’ll be doing the EE demo;
- MI: not formal process yet; recently forecasters been working with monitoring group and provide smoke information to notify them to look at events in more detail; don’t know if monitoring is doing flagging
- HMS smoke products have both graphical and text product to discuss smoke and origins of smoke
Review data for May – July


- Alternate pathways
- Regulatory significance
- Need to refine this analysis more